Government, Money, Resources, Work
Asian Americans pay higher personal income taxes
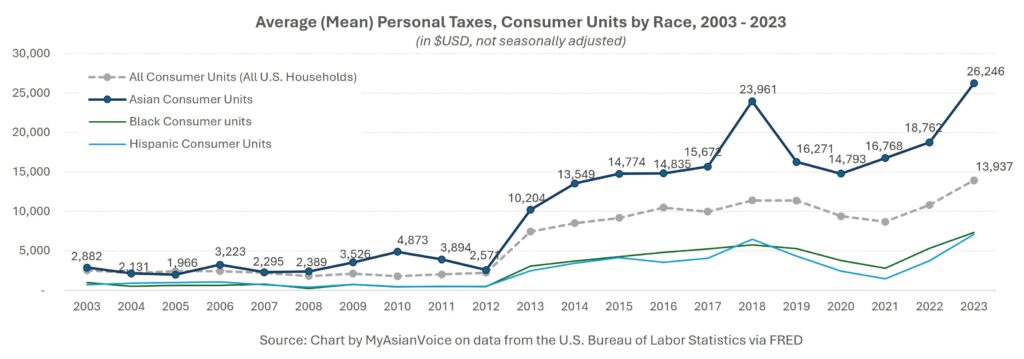
Every April, American households of all races and ethnicities file their personal income taxes. This year, the average Asian American household is likely to pay higher individual taxes than that of the average U.S. household. According to the U.S. Bureau of Labor Statistics (BLS), in 2023, Asian American households paid an average of $26,246 in personal taxes – nearly double the average paid by all U.S. households ($13,937). Even among high-income households, Asian households face higher individual income tax rates. Despite representing only 7% of the U.S. population, Asian American households contribute disproportionately more to federal and local tax revenues.

Every April, American households of all races and ethnicities file their personal income taxes. This year, the average Asian American household is likely to pay higher individual taxes than that of the average U.S. household. According to the U.S. Bureau of Labor Statistics (BLS), in 2023, Asian American households paid an average of $26,246 in personal taxes – nearly double the average paid by all U.S. households ($13,937).

Asian households pay the highest average personal taxes since 2006
Since 2003, BLS published the average personal tax amount, which includes federal, state, local, and other taxes, for Asian consumer units or Asian households. The data show that Asian households have paid the highest average personal taxes since 2006. Average personal taxes continue to increase, with notable jumps in 2013, 2018, and 2023, corresponding to changes in the U.S. tax code. In 2013, the tax rate increased for high-income Americans. In 2018, taxes rose due to fewer itemized deductions after the Tax Cuts and Jobs Act (TCJA) of 2017, and in 2023, tax brackets were adjusted for inflation.
High income Asian households face higher individual income tax rates
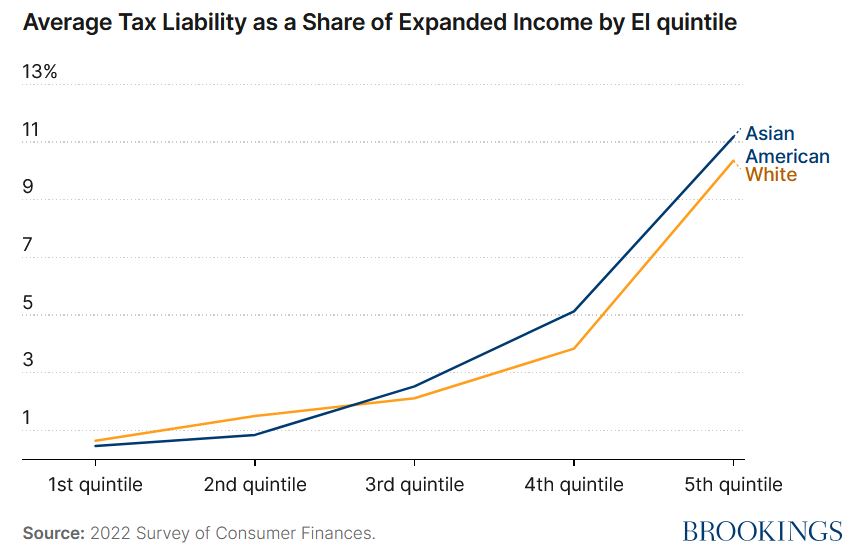
Even among high-income households, Asian American households face higher individual income tax rates than comparable White households, as highlighted in a recent Brookings analysis. Specifically, among households in the top 60% of the income distribution, Asian American households pay higher average tax rates (ATRs). The ATR is the ratio of income tax liability to expanded income. This disparity arises because Asian households earn a greater share of their income from fully taxable wages and salaries than White households.
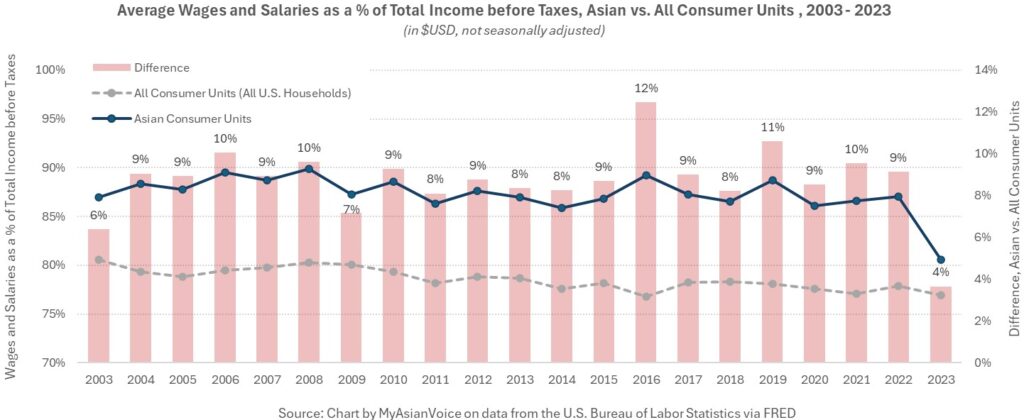
Asian households have higher share of income from taxable wages
BLS data show that wages and salaries constitute an average of 87% of Asian household income before taxes, significantly higher than the national average of 79% since 2003.
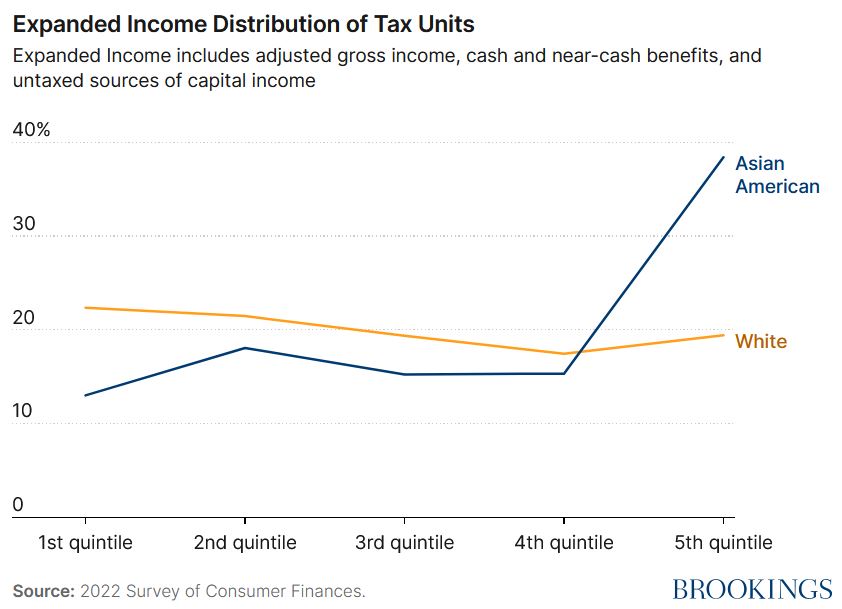
Income distribution of Asian households
While Asian households report higher median incomes, their households tend to be larger and include more income earners. The Federal Reserve Bank of St. Louis attributes this trend to more dual earners and higher educational attainment among Asian Americans. However, income distribution within the Asian American community is bimodal. Although a large proportion of Asian Americans are in the top 20% of the income distribution, a significant share is also at the lowest 20 to 40% of the distribution.
Asian households have a higher tax burden
Despite representing only 7% of the U.S. population, Asian American households contribute disproportionately more to federal and local tax revenues. Their higher tax burden stems from the type of income they earn and demographic factors such as a larger household size and dual earners.
***
This article contains original analysis and content developed by MyAsianVoice based on primary data published by third parties. While the underlying data may be publicly available, all insights, visualizations, and derived content, unless otherwise noted, are the intellectual property of MyAsianVoice and are protected under international copyright and intellectual property laws. If you use, reference, or cite any part of our analyzed data or content, you must provide full proper attribution. Required citation include: MyAsianVoice’s full name, title of the article, and direct link to the article.
Helpful Resources
Personal Taxes: Federal Income Taxes by Race: Asian (U.S. Bureau of Labor Statistics, Federal Reserve Bank of St. Louis)
Consumer Expenditure Surveys (U.S. Bureau of Labor Statistics)
We know more, but not enough, about the tax treatment of Asian American families (The Brookings Institution)
Get a monthly dose of our latest insights!


About
myasianvoice
At MyAsianVoice, we make disaggregated U.S. Asian data visible and accessible.
Subscribe to receive our latest insights >>