Government, Money, Resources, Work
What the data says about Asian-owned employer businesses
Compared to their U.S. population size of 7%, Asian Americans have a greater share of employer businesses. Asian-owned employer businesses represent 11% of all U.S. employer firms and provide substantial economic contributions, including an estimated $1.2 trillion in gross receipts and 5.4 million jobs, making them the largest contributors among all minority-owned business groups. Between 2017 and 2022, Asian-owned employer firms grew by 17% (+95,000) and became more diversified; however, the share of Asian-owned employer firm by state varies considerably—from 2% in Montana to 47% in Hawaii.

Did you know that among Asian-owned businesses with employees in the U.S., Asian Indians own more employer businesses than any other subgroup? According to the most recent Annual Business Survey (ABS) by the federal government, there were approximately 651,000 Asian-owned employer businesses in 2022. Of these, Asian Indian-owned employer businesses represented the largest share at 32% or 210,000, followed by Chinese-owned at 23% or 151,000.
Asian-owned employer businesses accounted for 11% of all U.S. employer firms, contributed an estimated $1.2 trillion in gross receipts, and generated 5.4 million jobs—the largest contribution among all minority-owned employer business groups. The ABS data shows the minority-owned business landscape is growing and diversifying.
U.S. employer firms details
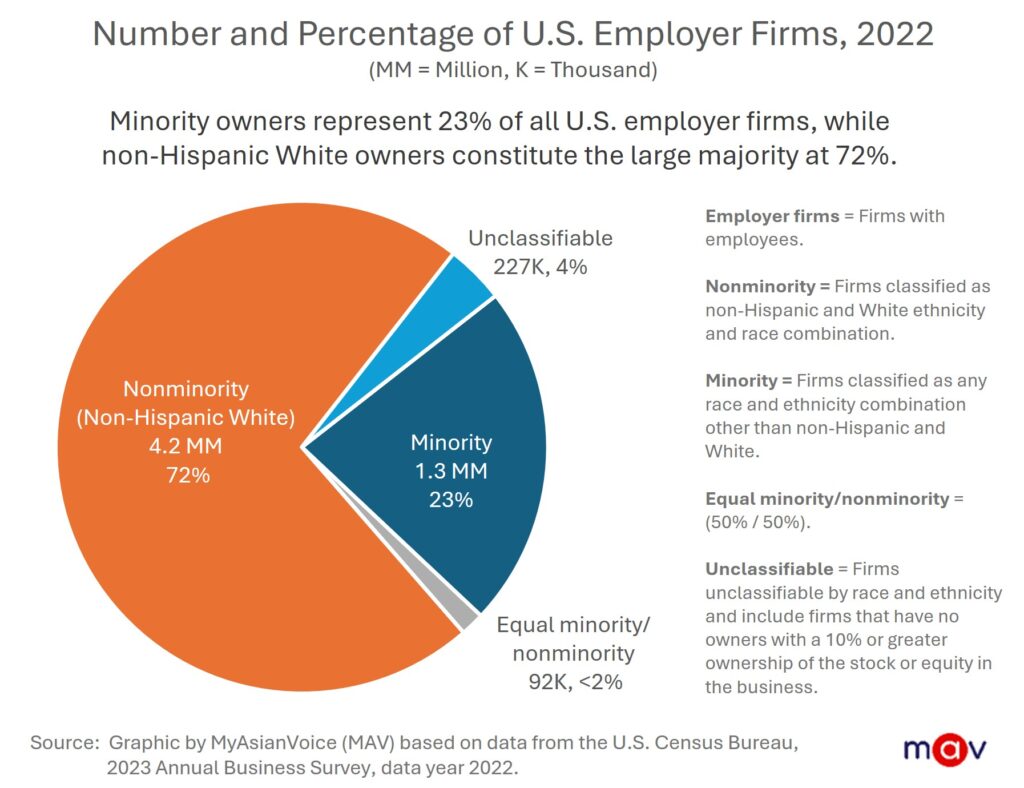
In 2022, there were approximately 35.7 million U.S. businesses, but the vast majority had no employees. Only 5.9 million were employer firms. Of these:
- 4.2 million or 72% were nonminority-owned (refers to non-Hispanic White)
- 1.3 million or 23% were minority-owned
- 92,000 or 2% were equally minority and nonminority-owned
- 227,000 or 4% were unclassifiable
Note: Within the ABS, minority firms are classified as any race and ethnicity combination other than non-Hispanic and White, and nonminority firms are classified as non-Hispanic and White. Unclassifiable firms are defined by firms that were unclassifiable by ethnicity and race status, and include firms that have no owners with a 10% or greater ownership of the stock or equity in the business.
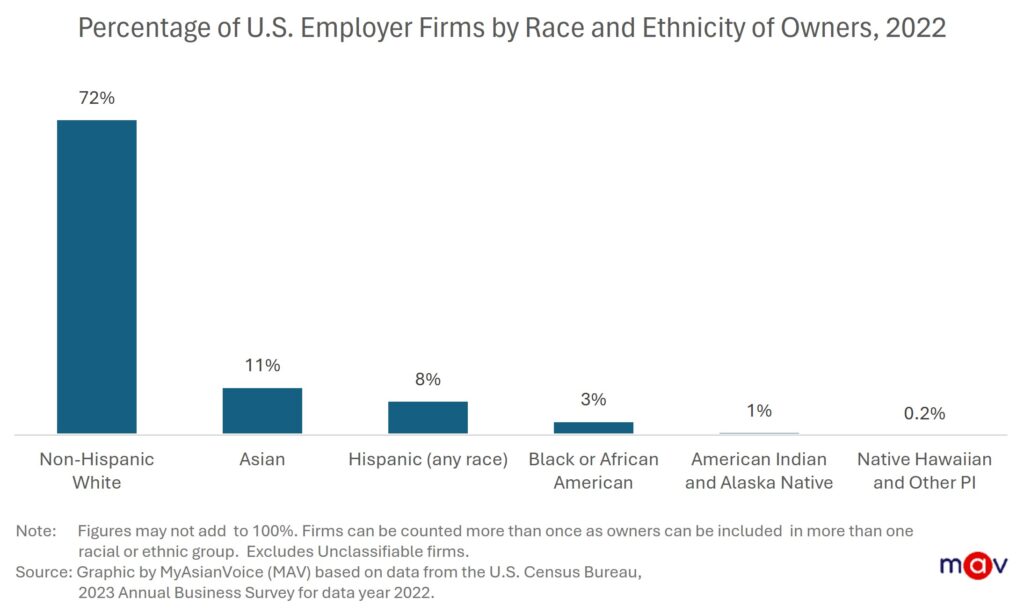
Within these categories:
- Non-Hispanic White-owned firms made up 72% of all employer firms
- Asian-owned represented 11%
- Hispanic-owned of any race were 8%
- Black-owned were 3%
- American Indian and Alaskan Native-owned were 1%
- Native Hawaiian and Other Pacific Islander-owned were 0.2%
Note: The ABS counts firms more than once if owners self-identify with multiple racial or ethnic groups.
Minority-owned employer firms
There were 1.3 million minority-owned employer firms in 2022, up from 1 million in 2017. Among them:
- Asian-owned represented 49% or 651,000
- Hispanic-owned of any race 35% or 465,000
- Black-owned 15% or 195,000
- American Indian and Alaskan Native-owned 4% or 48,000
- Native Hawaiian and Other Pacific Islander-owned 1% or 10,000
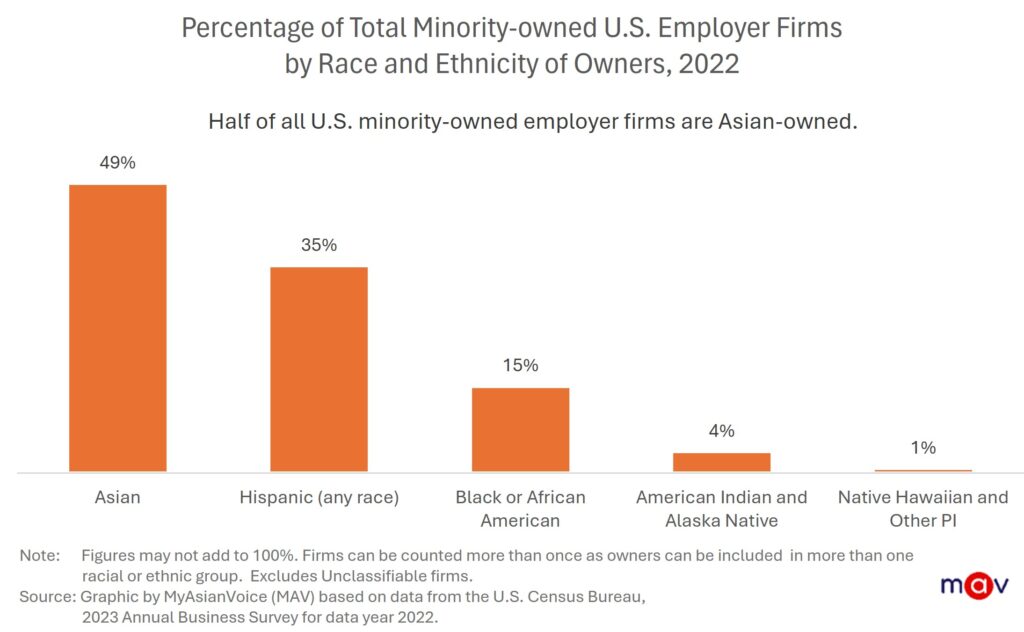
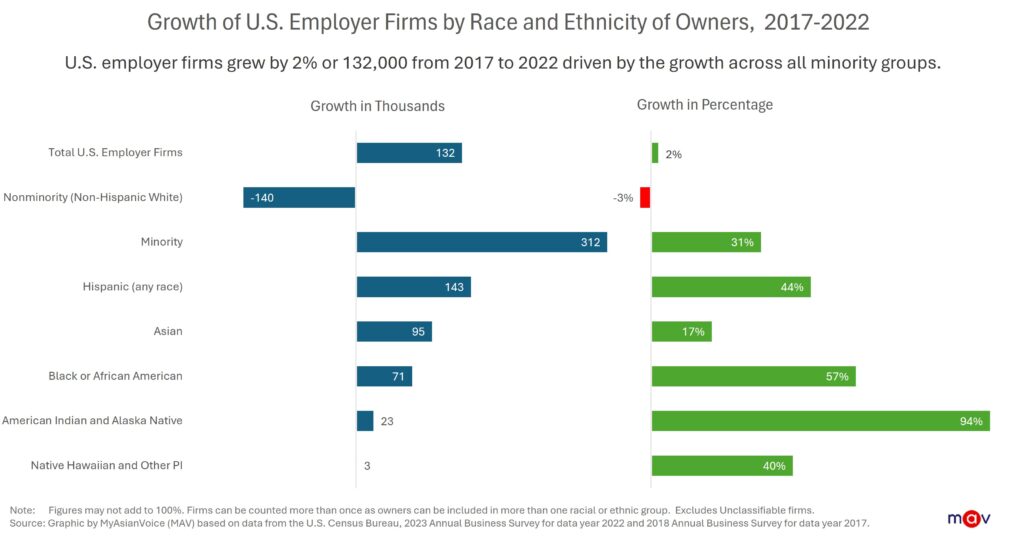
From 2017 to 2022, minority-owned employer firms increased across all racial and ethnic groups.
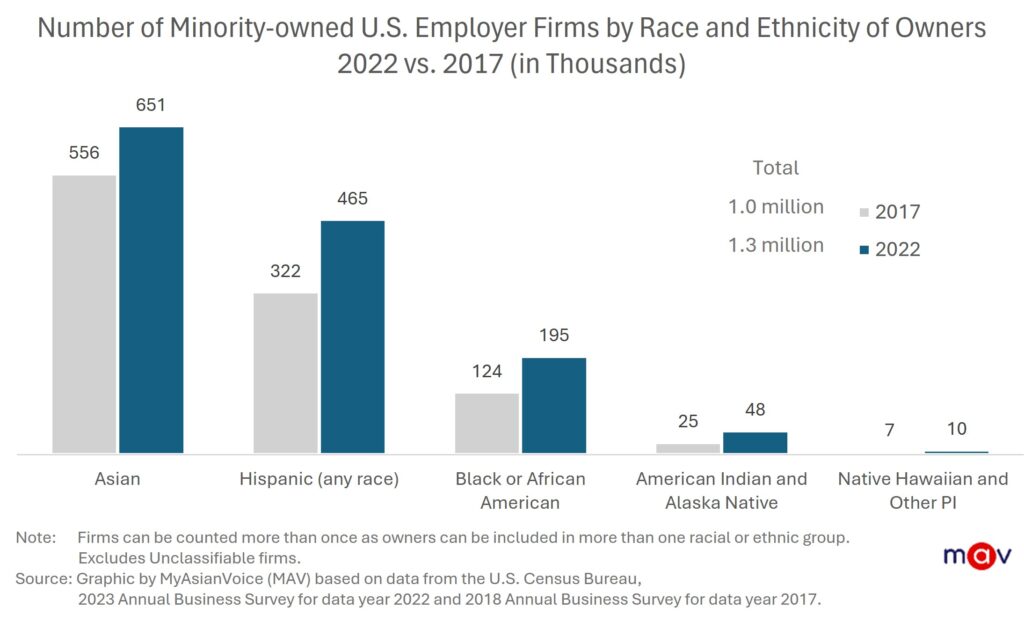
Growth in minority-owned employer firms
Minority-owned employer firms grew by 31% (an increase of 312,000), while non-Hispanic White-owned employer firms declined by 3% (a decrease of 140,000) from 2017 to 2022. The largest growth occurred among Hispanic-owned of any race (+143,000) and Asian-owned (+95,000) employer businesses. The fastest growth rates were among American Indian & Alaskan Native-owned (+94%) and Black-owned (+57%) employer firms.
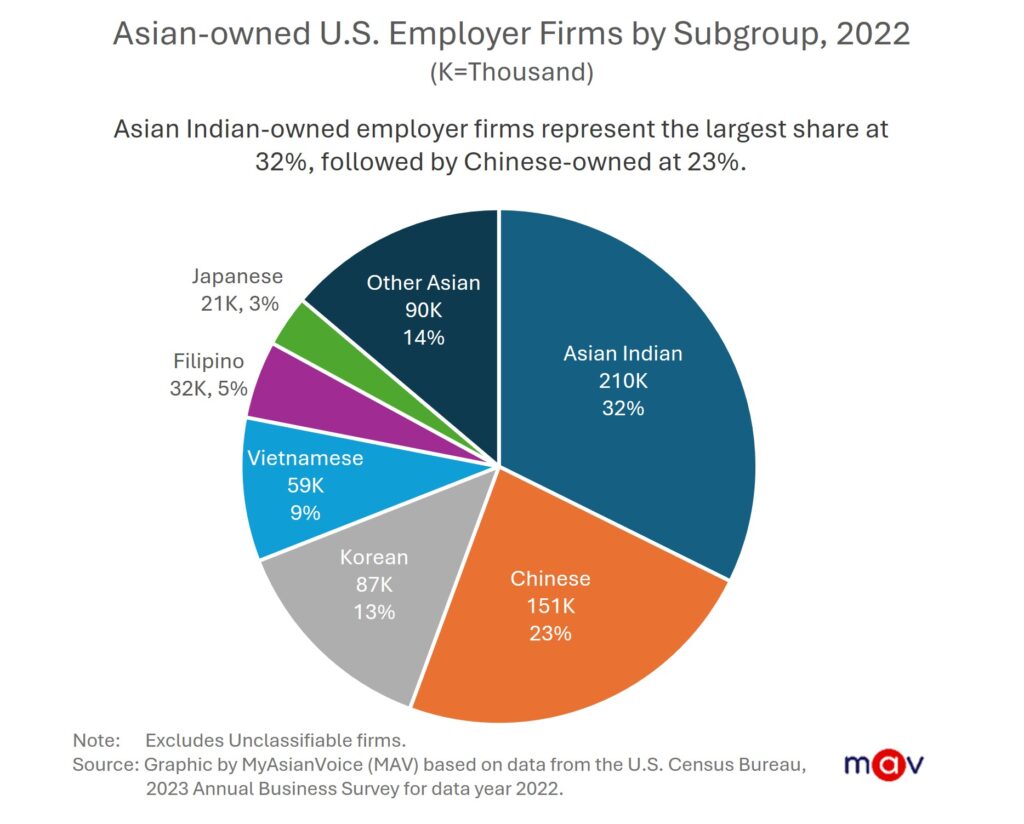
Asian-owned employer firms by subgroup
Of the 3.4 million Asian-owned U.S. businesses in 2022, 651,000 were employer firms—an increase from 556,000 in 2017. Among Asian-owned employer firms:
- Asian Indian-owned represented 32% or 210,000
- Chinese-owned were 23% or 151,000
- Korean-owned were 13% or 87,000
- Vietnamese-owned were 9% or 59,000
- Filipino-owned were 5% or 32,000
- Japanese-owned were 3% or 21,000
- Other Asian-owned comprised of 14% or 90,000
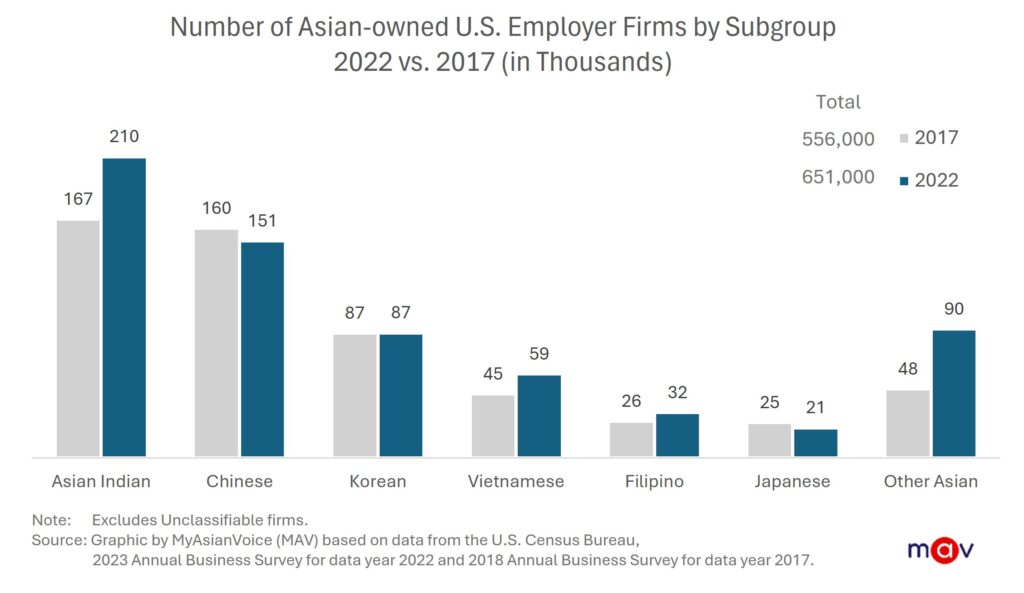
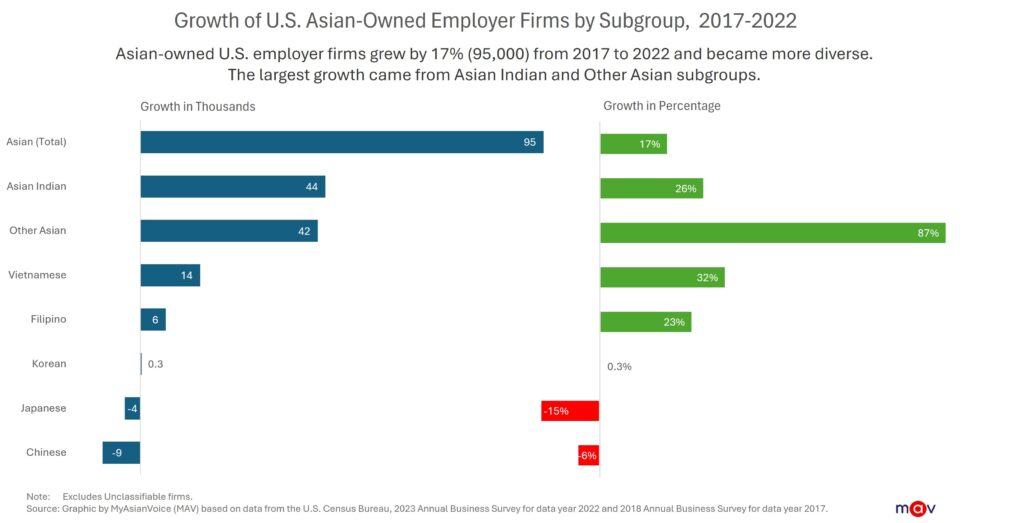
Growth in Asian-owned employer firms
Asian-owned employer firms grew 17% (+95,000) between 2017 and 2022 and became more diversified. The largest growth were in Asian Indian-owned (+44,000) and Other Asian-owned (+42,000) employer businesses. Other Asian-owned employer firms grew the fastest at 87%, while Chinese-owned saw a 6% decline and Japanese-owned a 15% decline over the same time period.
Note: Other Asian includes Asian subgroups other than Asian Indian, Chinese, Filipino, Vietnamese, Korean, and Japanese.
Receipts and employment
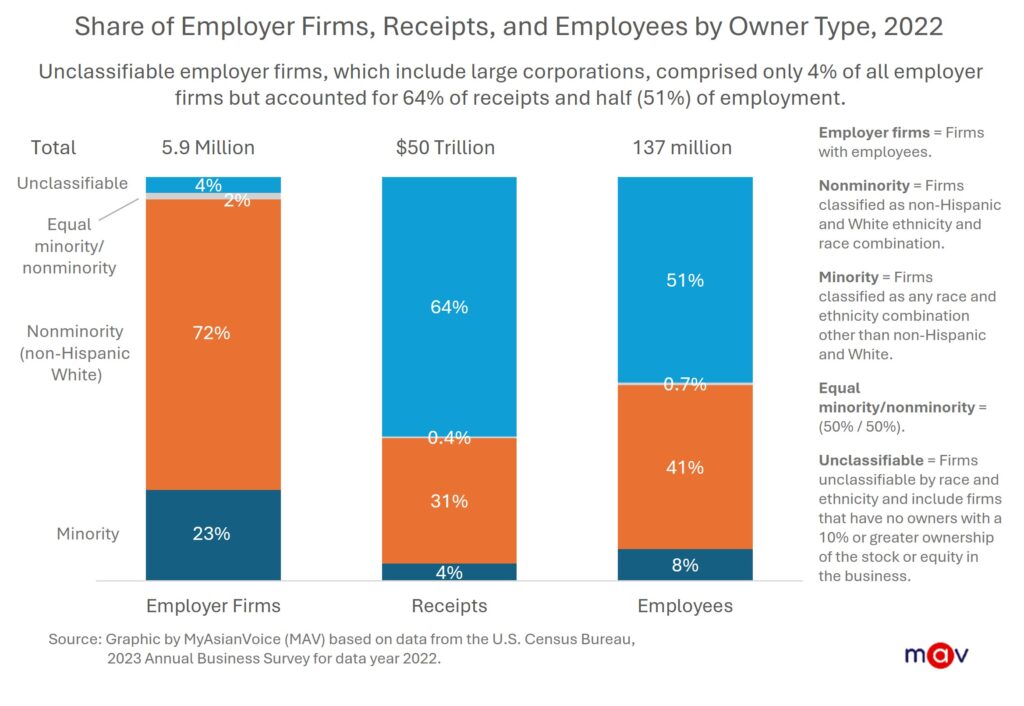
In 2022, 5.9 million U.S. employer firms generated $50 trillion in gross receipts and employed about 137 million people.
Note: The ABS defines receipts as sales, value of shipment, or revenue.
- Unclassifiable employer firms, which include large corporations, comprised only 4% of all employer firms but accounted for 64% of receipts and 51% of employment.
- Non-Hispanic White-owned firms made up 72% of all employer firms and 31% of receipts.
- Minority-owned employer firms represented nearly a quarter (23%) of all employer firms but only 4% of receipts.
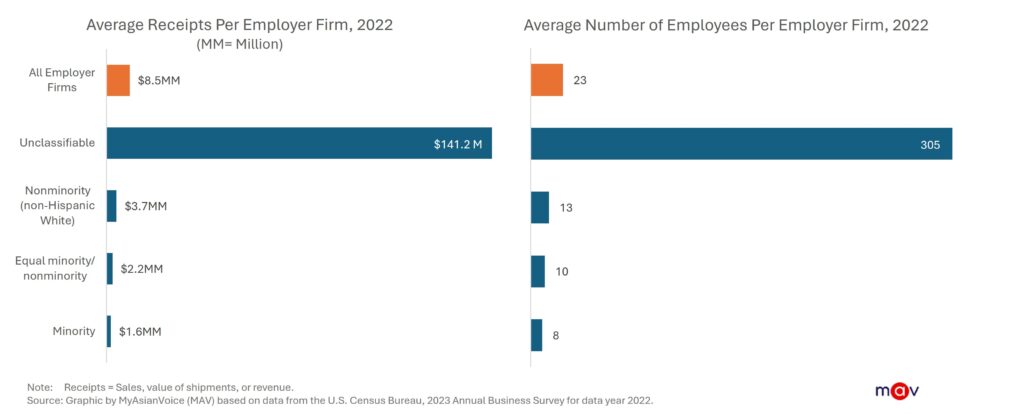
The average U.S. employer firm generated $8.5 million in receipts and had 23 employees, skewed by unclassifiable employer firms.
- Unclassifiable: average of $141 million in receipts and 305 employees (far greater than the average employer firm)
- Nonminority-owned: average of $3.7 million and 13 employees
- Minority-owned: average of $1.6 million and 8 employees
Receipts and employment of Asian-owned employer firms
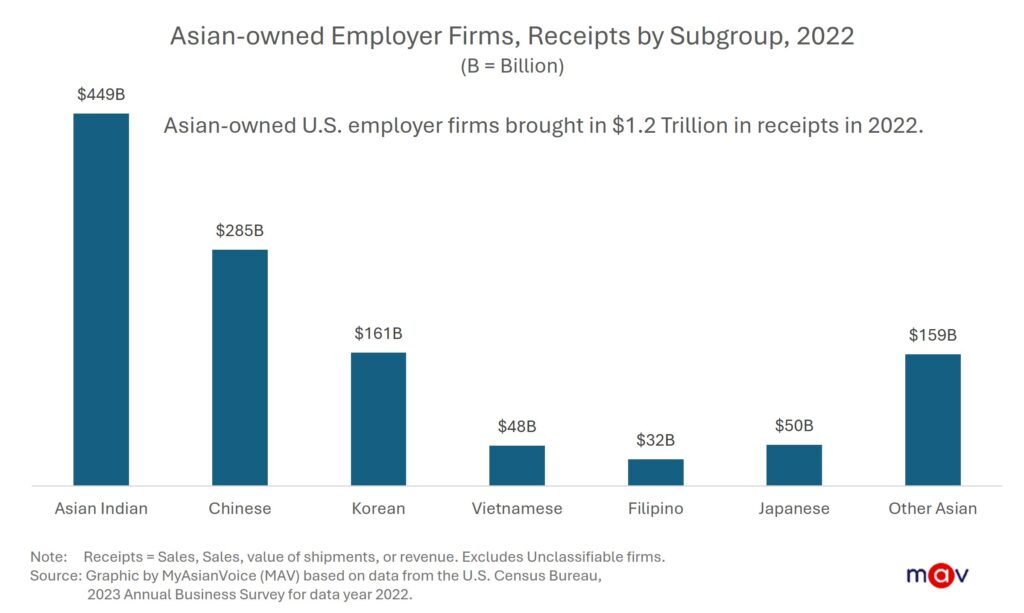
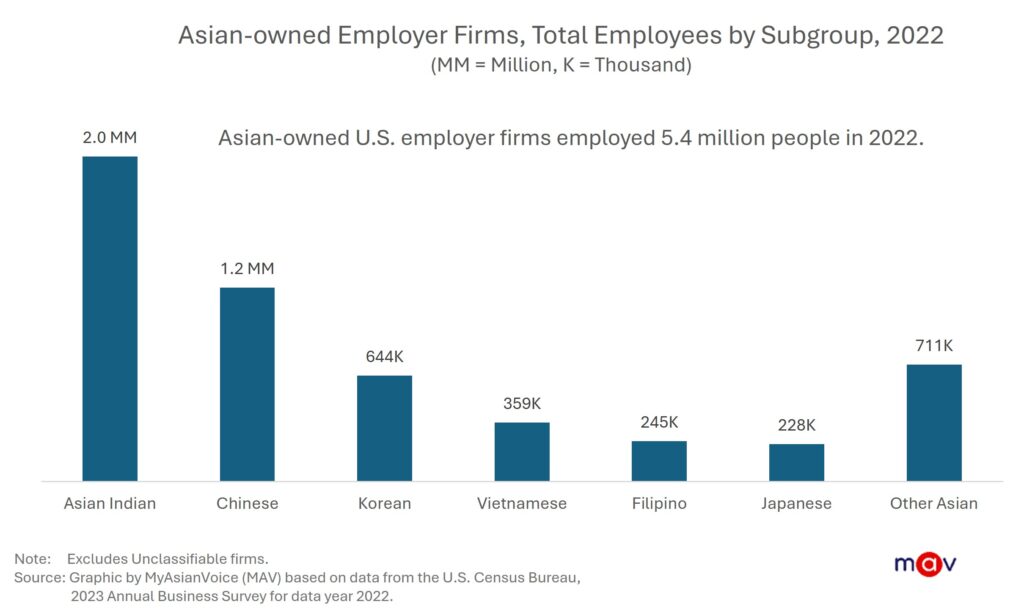
Among minority-owned employer firms, Asian-owned firms had the highest receipts at $1.2 trillion and employed about 5.4 million people. Breaking this down:
- Asian Indian-owned: $449 billion in receipts and 2 million employees
- Chinese-owned: $285 billion and 1.2 million employees
- Korean-owned: $161 billion and 644,000 employees
- Receipts and employment numbers were sharply lower for Vietnamese-, Filipino-, and Japanese-owned businesses.
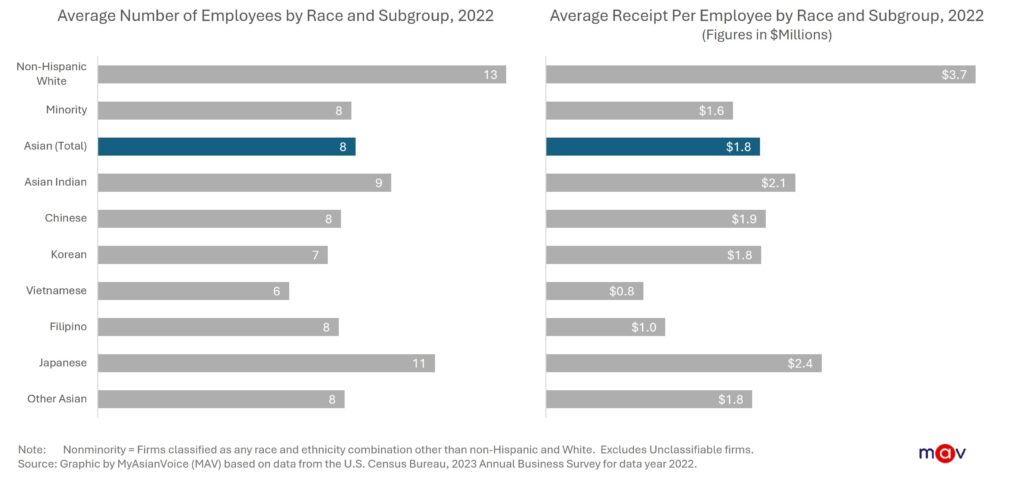
The average Asian-owned employer firm had 8 employees and $1.8 million in receipts, varying by subgroup:
- Asian Indian-owned: average of 9 employees and $2.1 million in receipts
- Chinese-owned: average of 8 employees and 1.9 million
- Korean-owned: average of 7 employees and $1.8 million
- Vietnamese-owned: average of 6 employees and $0.8 million (fewest employees and lowest average receipts)
- Filipino-owned: average of 8 employee and $1.0 million
- Japanese-owned: average of 11 employees and $2.4 million (most employees and highest average receipts)
- Other Asian-owned: average of 8 employees and $1.8 million
State concentration of Asian-owned employer firms
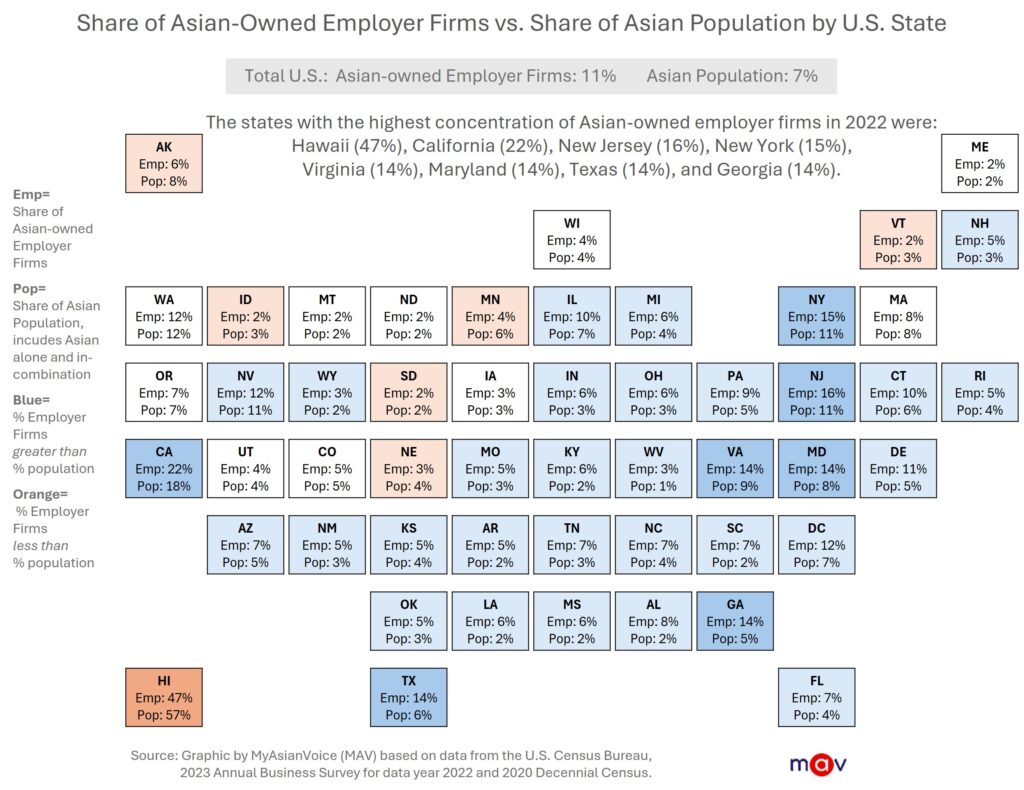
Compared to their population share of 7%, Asian Americans have a greater share of employer businesses. They make up 11% of all U.S. employer firms, with state-level concentrations ranging from 2% in Montana to 47% in Hawaii. Across most U.S. states, the share of Asian-owned employer firms is greater than the share of its Asian population, particularly in the South and Northeast.
States with the highest concentration of Asian-owned employer firms in 2022 were: Hawaii (47%), California (22%), New Jersey (16%), New York (15%), Virginia (14%), Maryland (14%), Texas (14%), and Georgia (14%).
Outsized contributors amid a challenging landscape
Asian-owned employer businesses are significant contributors to the U.S. economy, leading in all minority-owned employer businesses in both numbers and economic output. Although Asian-owned employer firms tend to be smaller in size and face barriers to capital and funding, they continue to grow and diversify. However, their growth and contributions will be challenged by federal policy such as changing federal tariffs and the elimination of the federal Minority Business Development Agency (MBDA).
***
This article contains original analysis and content developed by MyAsianVoice based on primary data published by third parties. While the underlying data may be publicly available, all insights, visualizations, and derived content, unless otherwise noted, are the intellectual property of MyAsianVoice and are protected under international copyright and intellectual property laws. If you use, reference, or cite any part of our analyzed data or content, you must provide full proper attribution. Required citation include: MyAsianVoice’s full name, title of the article, and direct link to the article.
Useful Resources
Annual Business Survey: Statistics for Employer Firms by Race for the U.S. (U.S Census Bureau)
Annual Business Survey: Statistics for Employer Firms by Ethnicity for the U.S. (U.S Census Bureau)
New Data on Minority-Owned, Veteran-Owned and Women-Owned Businesses (U.S Census Bureau)
Get a monthly dose of our latest insights!


About
myasianvoice
At MyAsianVoice, we make disaggregated U.S. Asian data visible and accessible.
Subscribe to receive our latest insights >>