Asian Americans make up a diverse and important part of the U.S. workforce. When looking at the big picture, many Asian Americans are concentrated in both high-paying fields—such as computer science, math, engineering, health, and business—and low-paying sectors like service and production. But when we look at the data more closely, employment patterns among Asian Americans often reflect the connection between education, immigration, and job opportunities. For example, Taiwanese and Asian Indian workers—many of whom came to the U.S. through employment or student visas and hold advanced degrees—are heavily represented in high-paying occupations. Meanwhile, Burmese and Laotian workers—many of whom arrived as refugees and tend to have lower educational attainment—are more often employed in lower-paying occupations. Recent federal policy changes—such as the current administration’s $100,000 H-1B visa fee, tighter restrictions on international student visas, and planned cuts to refugee admissions—may reshape the composition and opportunities within the Asian American workforce in the years ahead.

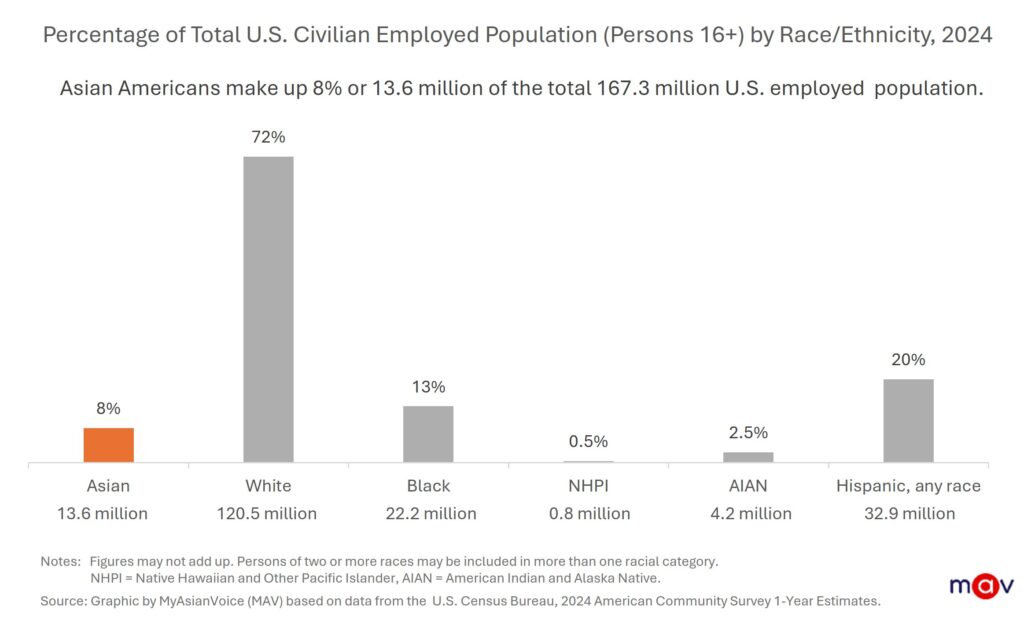
In 2024, roughly 167.3 million Americans aged 16 or older were employed. Asian Americans make up 8% or about 13.6 million of the U.S. workforce. This includes 11.6 million people or 7% identifying as Asian alone and 2.0 million or 1% identifying as Asian and another race. White Americans held the largest share of the workforce at 72% or 120.5 million, followed by Hispanic Americans at 20% or 32.9 million, Black Americans at 13% or 22.2 million, Native Hawaiian and Other Pacific Islander (NHPI) at 0.5% or 765,000, and American Indian and Alaska Native (AIAN) at 2.5% or 4.2 million.
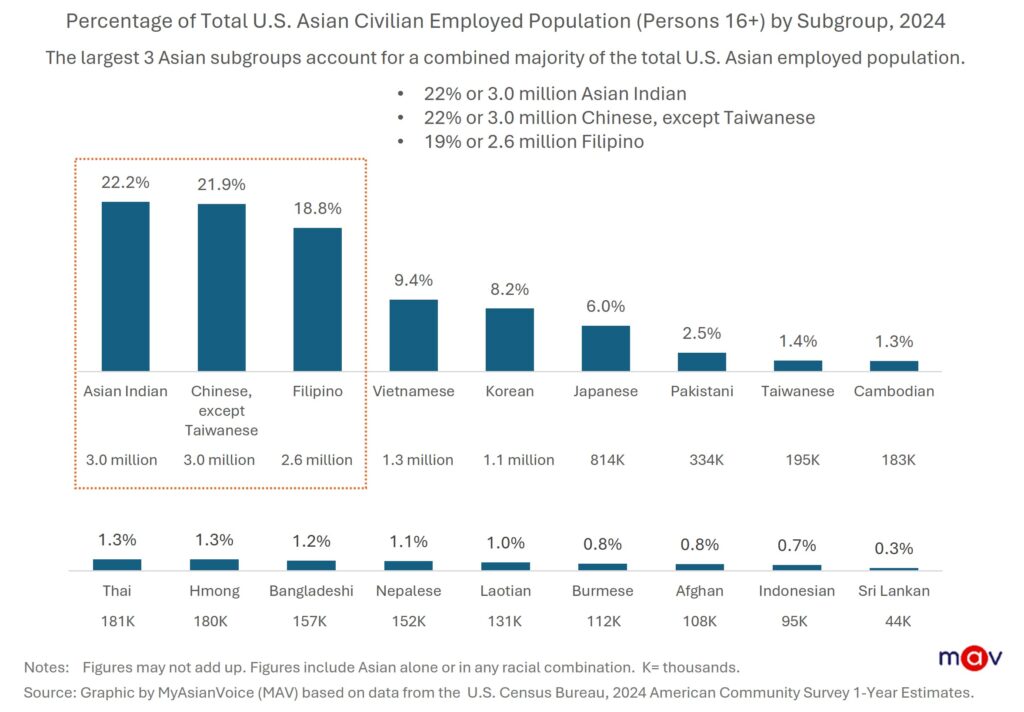
While Asian Americans represent about 1 in 12 U.S. workers, just 3 Asian subgroups make up most of that total. Asian Indian and Chinese, excluding Taiwanese, equally account for 22% or 3.0 million of all Asian American workers each, followed by Filipino Americans at 19% or 2.6 million. Vietnamese Americans make up about 9% or 1.3 million, Koreans 8% or 1.1 million, and Japanese 6% or 814,000, with smaller subgroups making up the rest.
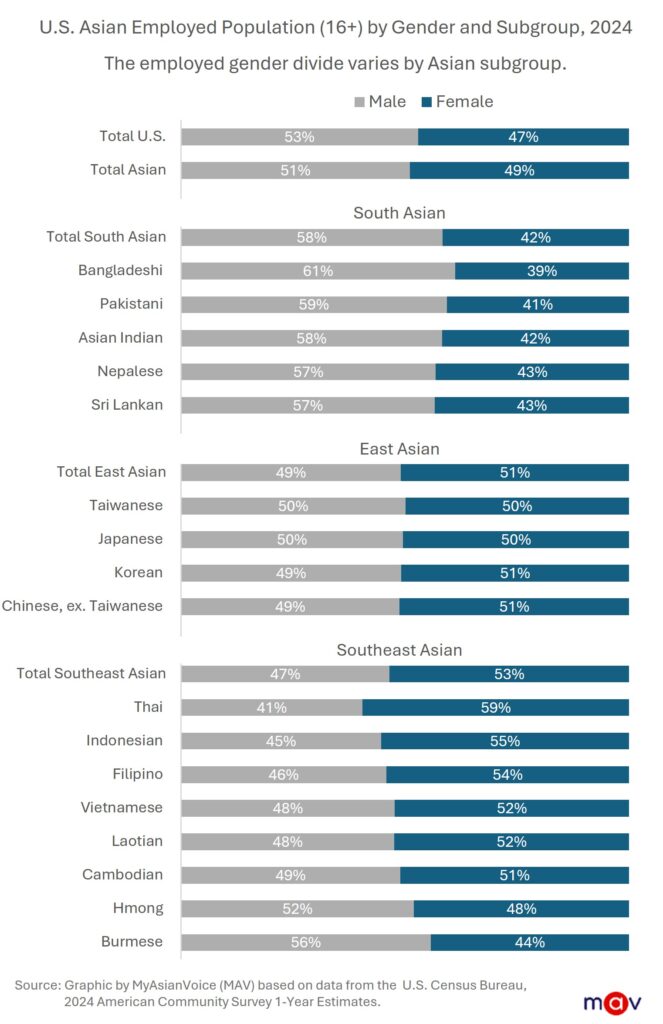
Gender divide varies by Asian subgroup
Across the U.S., more men than women are employed overall, reflecting ongoing income disparities for women. However, these patterns differ among Asian Americans and vary by region and country of origin. Among Southeast Asians, women comprise a larger share of the employed population at 53%, while among South Asians, men make up a larger share at 58%. East Asians are about evenly split—51% for men and 49% for women. Moreover, Bangladeshi workers have one of the largest shares of men working at 61%, while Thai workers have one of the highest shares of women working at 59%.
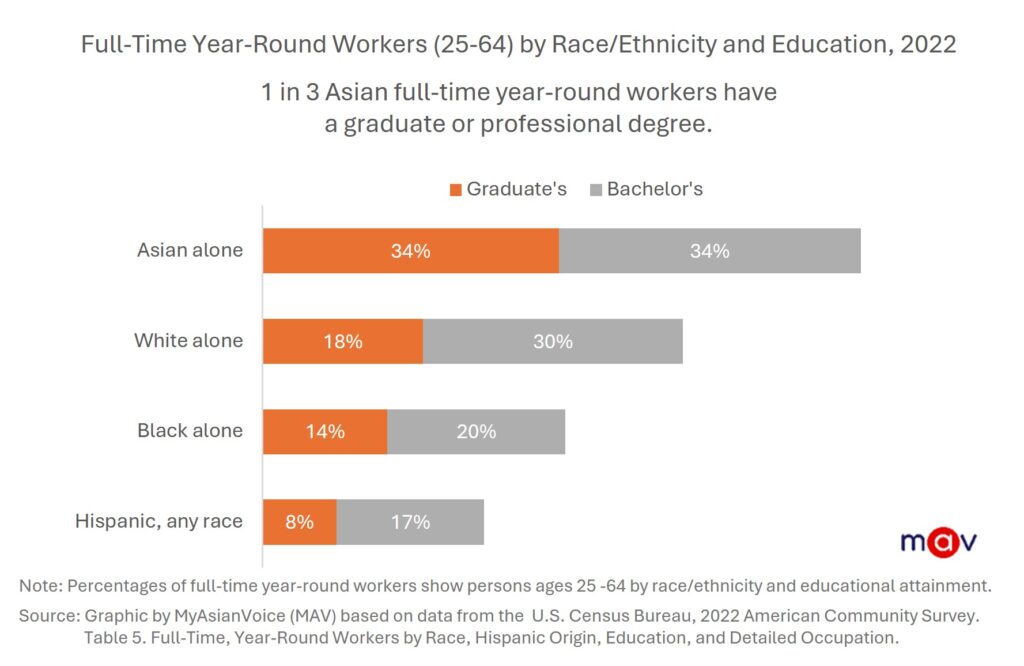
1 in 3 Asian workers have an advanced degree
A third of full-time employed Asian Americans aged 25–64 hold a graduate or professional degree, the highest rate of any racial group in the U.S. This trend stems from U.S. immigration policies that favored employment-based immigration starting in 1965 and highly-skilled and educated foreign workers under the H-1B program since 1990; and it also stems from the explosive growth of international students—especially students from China and India—since the late 1940s. For comparison, 18% of White, 14% of Black, and 8% of Hispanic full-time workers hold advanced degrees.
Higher-paying occupations by race/ethnicity
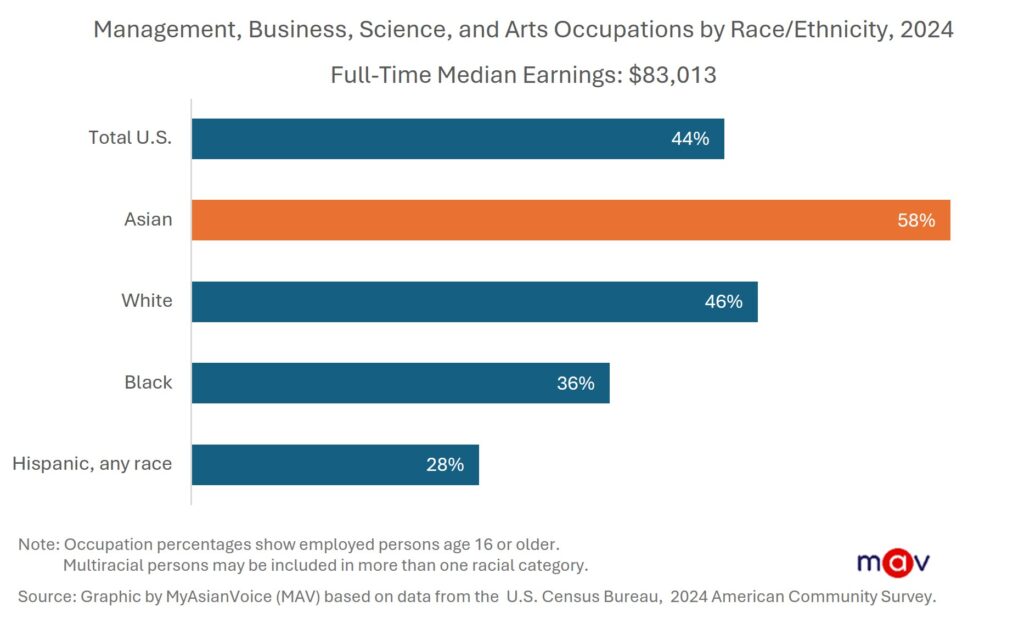
Workers in high-paying jobs in management, business, science, and arts are more likely to have an advanced degree. The median income for this occupational group nationwide was $83,013 in 2024, well above the overall median of $61,702 for all occupations. In 2024, 58% of employed Asian Americans worked in management, business, science, and arts occupations—the highest rate among all racial groups—which aligns with the population’s higher educational attainment.
Higher-paying occupations by Asian subgroup
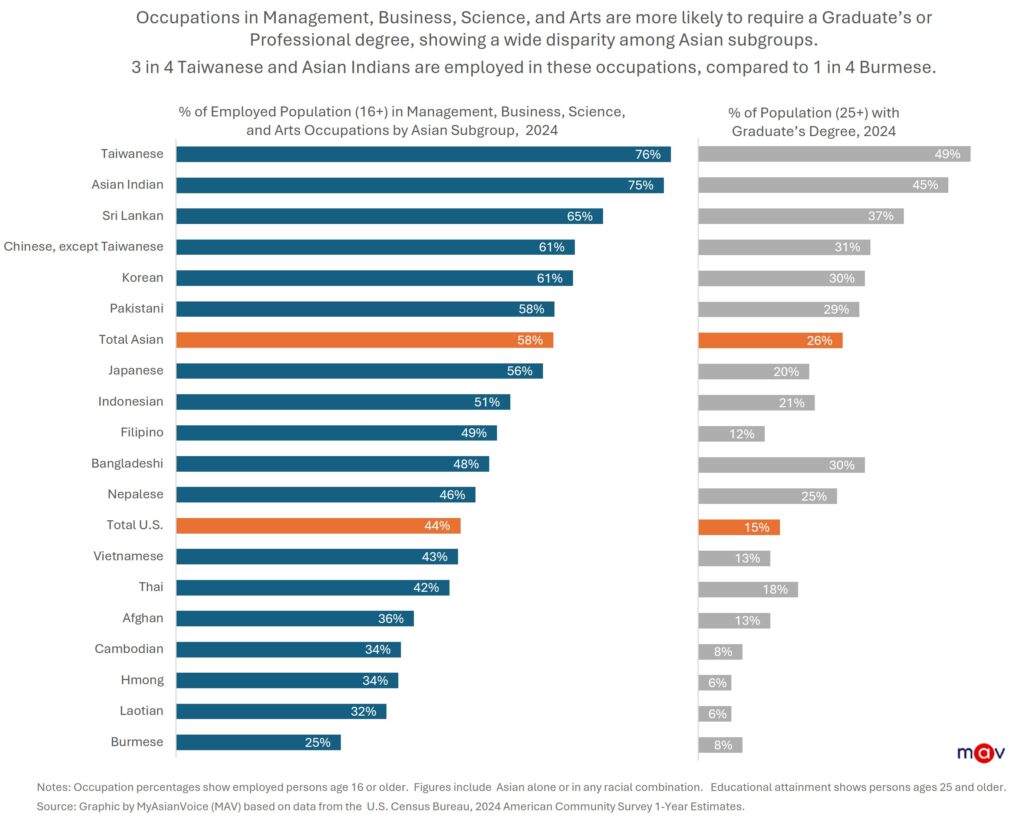
Three-quarters of employed Taiwanese and Asian Indian workers aged 16 or older are in high-paying fields such as management, business, science, and the arts—well above the 58% Asian average. This correlates to Taiwanese and Asian Indian Americans’ high educational attainment—49% of Taiwanese and 45% of Asian Indians hold advanced degrees, much higher than 15% for all Americans and 26% for all Asian Americans. By contrast, fewer than 10% of Burmese, Laotian, and Cambodian workers have graduate or professional degrees, and they are over-represented in lower-paying occupations.
Lower-paying occupations by race/ethnicity
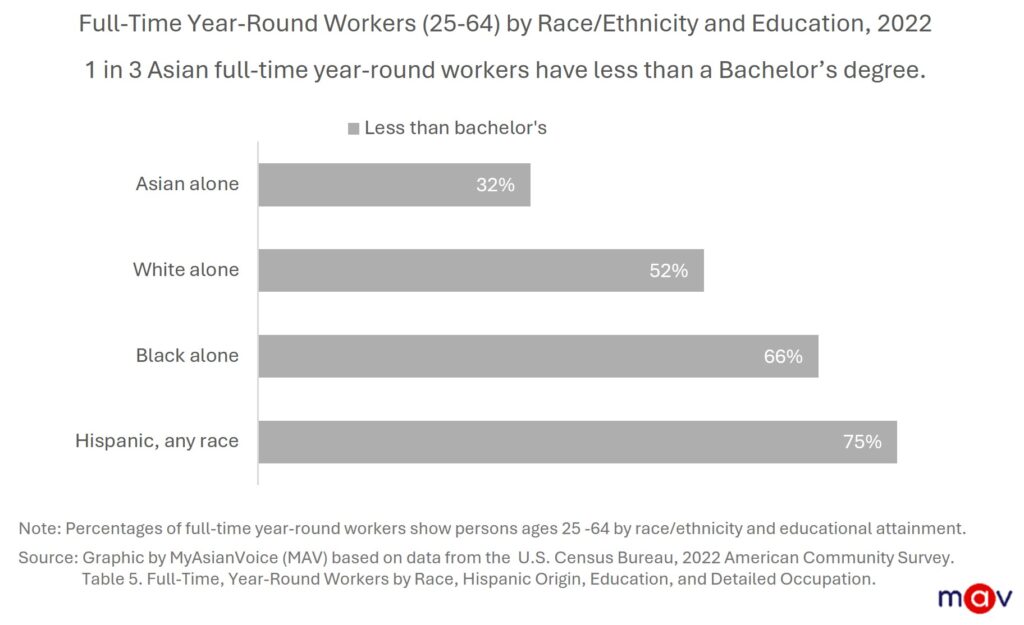
About one-third of full-time Asian workers aged 25–64 have less than a bachelor’s degree, compared with 52% of White, 66% of Black, and 75% of Hispanic workers.
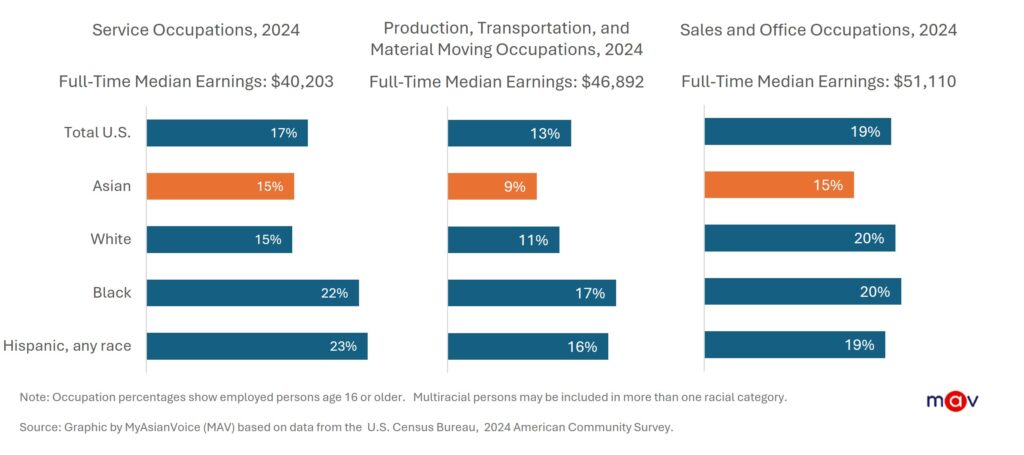
As a group, Asian Americans are underrepresented in lower-paying fields such as service, production, transportation, material moving, sales, and office work. The median full-time, year-round earnings in 2024 were $40,203 for service occupations, $46,892 for production, transportation, and material moving occupations, and $51,110 for sales and office occupations. About 40% of the U.S. Asian workforce is employed in these occupations, compared to nearly half of the overall U.S. workforce. When broken down by subgroup, many smaller Asian groups with lower educational attainment are disproportionately represented in these jobs.
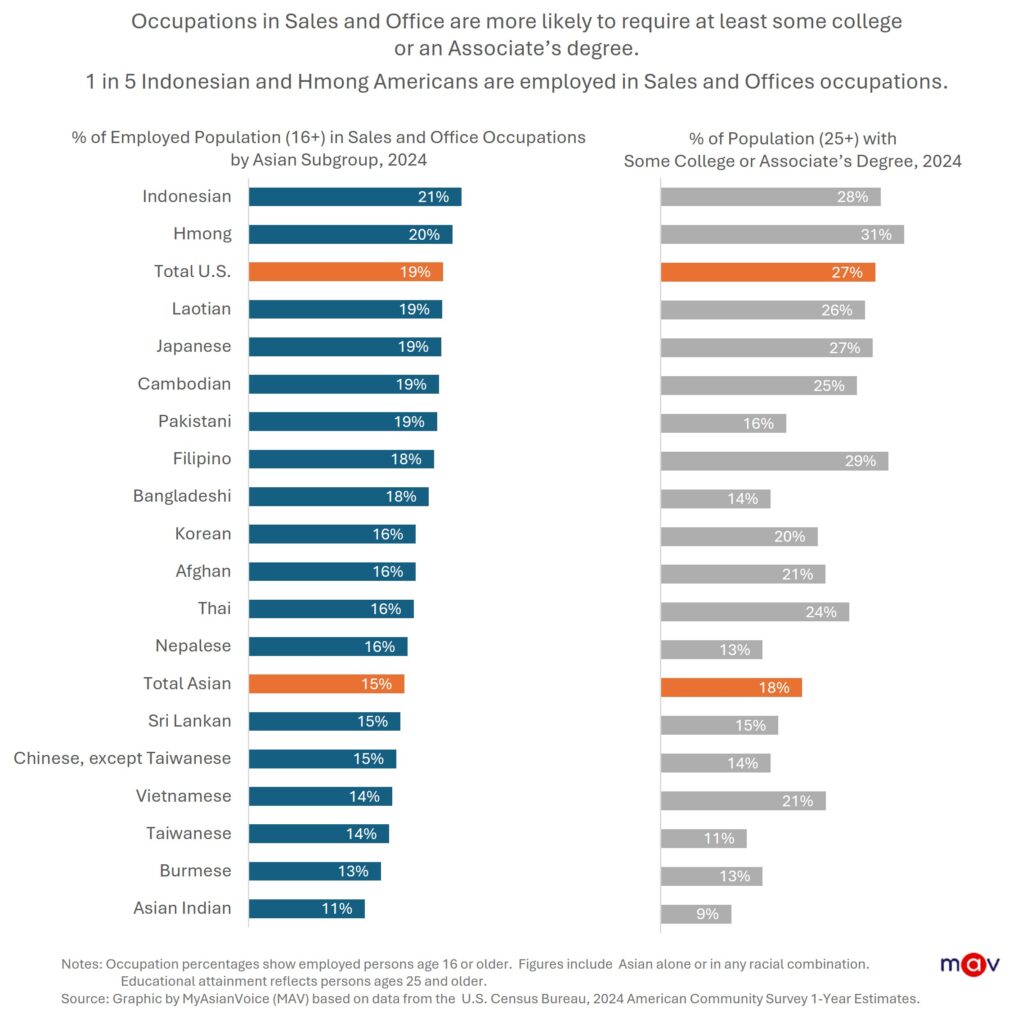
Lower-paying occupations by Asian subgroup
Sales and office occupations are more likely to require at least some college education. Approximately 18% of Asian Americans aged 25 or older have some college education or an associate’s degree, with wide variation among Asian subgroups. For example, Indonesian and Hmong Americans have some of the highest shares among Asian Americans with some college education or an associate’s degree, and they are more likely to work in sales or office professions with 1 in 4 workers in these jobs.
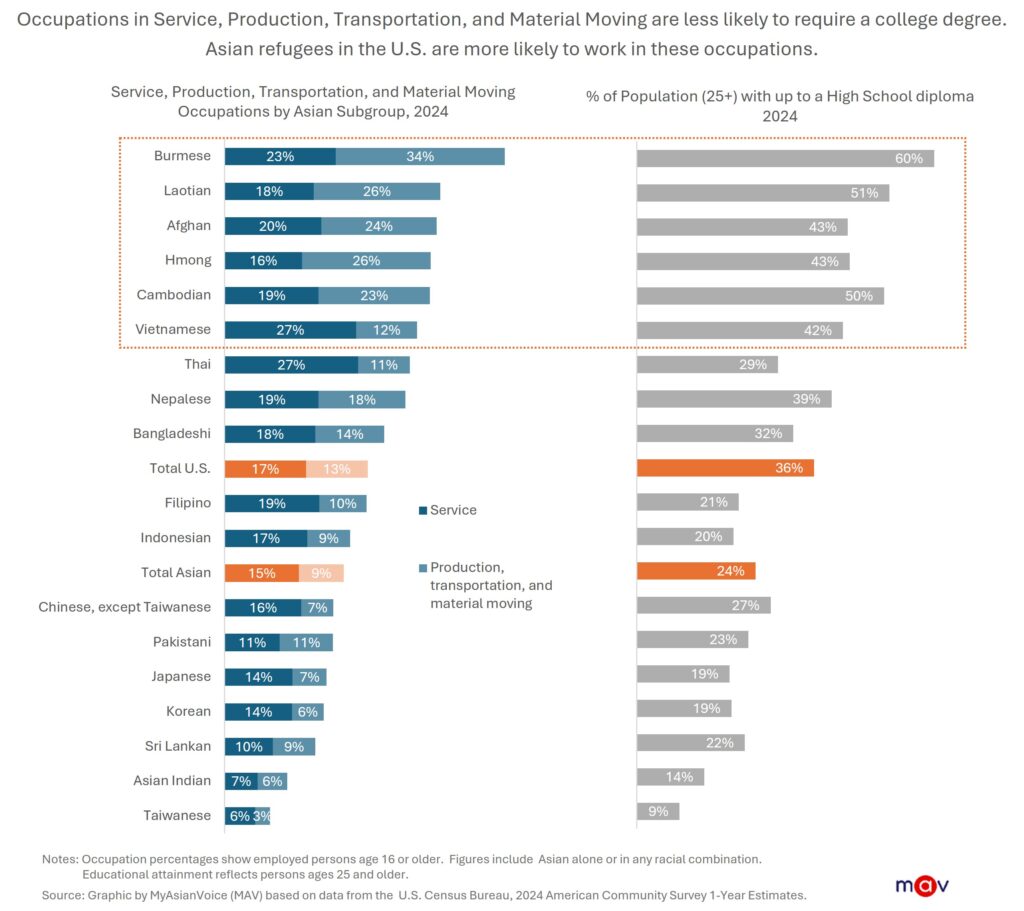
Lower-paying service, production, transportation, and material moving occupations are less likely to require a college degree. Many Asian Americans who came to the U.S. as refugees or through family sponsorship were more likely to have lower education levels and limited English proficiency, and they are more likely to work in these lower-paying jobs. For instance, among Burmese Americans, 60% have a high school education or less, and 57% in service or production-related occupations. Laotian, Afghan, Hmong, Cambodian, and Vietnamese Americans show similar trends, often reflecting immigration paths and educational opportunities.
Overall, Asian Americans’ employment patterns reflect the intersections of education, immigration path, and occupational outcomes. However, recent federal policy changes—such as the administration’s $100,000 H-1B visa fee, tighter restrictions on international student visas, and planned cuts to refugee admissions—may reshape the composition and opportunities within the Asian American workforce in the years ahead.
***
This article contains original analysis and content developed by MyAsianVoice based on primary data published by third parties. While the underlying data may be publicly available, all insights, visualizations, and derived content, unless otherwise noted, are the intellectual property of MyAsianVoice and are protected under international copyright and intellectual property laws. If you use, reference, or cite any part of our analyzed data or content, you must provide full proper attribution. Required citation include: MyAsianVoice’s full name, title of the article, and direct link to the article.
Helpful Resources
Employed persons by detailed occupation, sex, race, and Hispanic or Latino ethnicity, 2024 (U.S. Bureau of Labor Statistics)
Which jobs have the highest representation of Asian Americans? (USAFacts)
Get a monthly dose of our latest insights!


About
myasianvoice
At MyAsianVoice, we make disaggregated U.S. Asian data visible and accessible.
Subscribe to receive our latest insights >>