Family, Government, Resources
Newly released detailed census data makes visible 19 additional Asian groups
Asian Americans grew to over 24.0 million in 2020. Newly released detailed census data show Asian Indians (4.4 million) surpassing Chinese ex. Taiwanese as the largest Asian alone population. When you include mixed Asians, Chinese ex. Taiwanese (5.2 million) is the largest Asian alone or in any combination population. Nepalese grew the fastest, almost tripling its population to 219.5 thousand. If you are of Afghan, Mien, Sikh or Uzbeck descent, you are now visible in the census’ detailed data that includes information on nearly 1,500 race and ethnicity groups, tribes, and villages – more than 200 detailed race and ethnic groups not tabulated from previous censuses.
America is becoming more diverse and multiracial. Detailed racial and ethnic composition help us understand our country’s changing demographics. For Asian Americans, the newly released detailed census data makes visible 19 additional Asian racial and ethnic groups and tells the increasing diversity of Asians in America.
Asian data highlights from 2010 to 2020
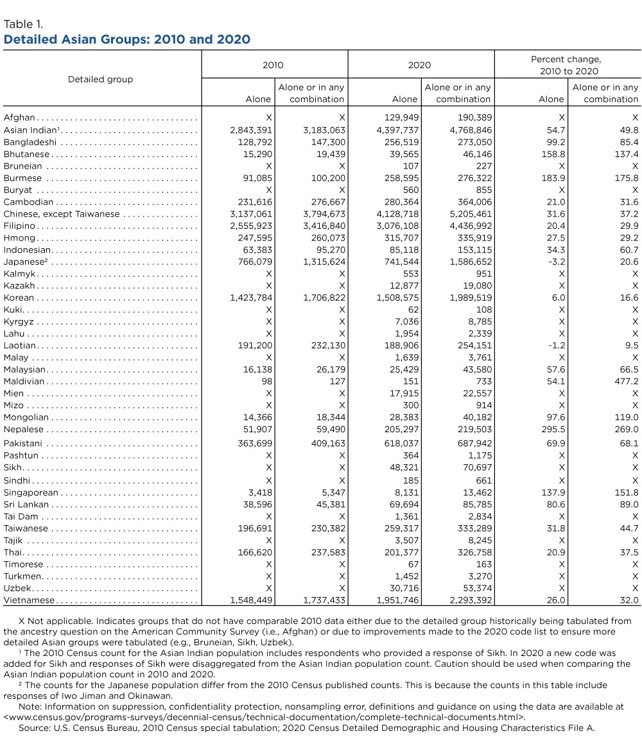
Counts for 41 Asian groups of which 19 groups were not tabulated from previous censuses.
- New Asian population counts for Afghan, Bruneian, Buryat, Kalymyk, Kazakh, Kuki, Kyrgyz, Lahu, Malay, Mien, Mizo, Pashtun, Sikh, Sindhi, Tai Dam, Tajik, Timorese, Turkmen, and Uzbek.
- Asian Indian alone (4.4 million, up +54.7%) is the largest Asian alone population.
- Chinese ex. Taiwanese alone or in any combination (5.2 million, up +37.2%) is the largest Asian alone or in any combination population.
- Nepalese (219.5 thousand, up +269.0%) was the fastest growing Asian alone or in any combination population.
- Japanese alone (741.5 thousand, down -3.2%) and Laotian alone (188.9 thousand, down -1.2%) were the only detailed Asian groups to experience a decrease, but their alone or in any combination populations increased by +20.6% and +9.5%, respectively.
The six largest Asian alone groups below, represent 80% of the total Asian alone population.
- Asian Indian alone, 4.4 million up +54.7%.
- Chinese ex. Taiwanese alone, 4.1 million, up +31.6%.
- Filipino alone, 3.1 million, up +20.4%.
- Vietnamese alone, 2.0 million, up +26.0%.
- Korean alone, 1.5 million, up +6.0%.
- Japanese alone, 0.7 million, down -3.2%.
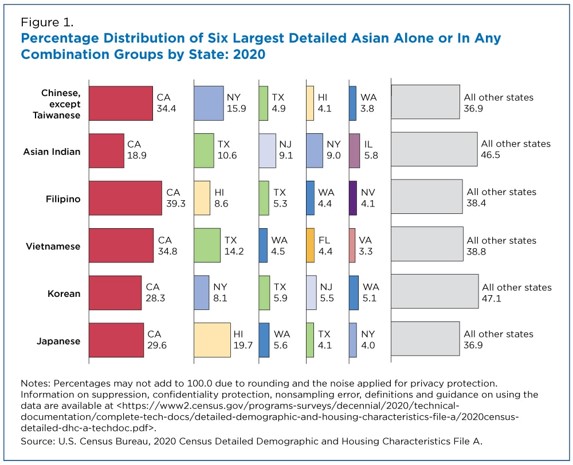
Distribution of the six largest Asian groups by state
- More Asian Americans are calling Washington home. Washington surpassed New Jersey to become the state with the fifth largest proportion of the Chinese ex. Taiwanese alone or in any combination population. It surpassed Virginia with the fifth largest proportion of the Korean alone or in any combination population.
- California continues to have the largest Asian population. Nearly a third of Chinese ex. Taiwanese, Filipino, Vietnamese, Korean, and Japanese reside in California.
- Half of all Chinese ex. Taiwanese (CA & NY), Vietnamese (CA & TX), and Japanese (CA & HI) live in just two states.
Native Hawaiian and Other Pacific Islander
- Nearly all NHPI groups grew from 2010 to 2020.
- Native Hawaiian was the largest Native Hawaiian and Other Pacific Islander (NHPI) alone group (199.9 thousand) and alone or in any combination group (680.4 thousand).
- Chuukese alone population (10.5 thousand, up +296.2%) was the fastest growing NHPI alone group.
Other data highlights
White: A majority of the nation’s White population reported a detailed European identity in 2020. The most common group was English. 25.5 million people reported English alone and 46.6 million people reported English alone or in any combination. English (46.6 million), German (45.0 million), and Irish (38.6 million) alone or in any combination populations made up more than half of the White alone or in combination population in 2020.
Black or African American: African American was the largest detailed group reported. 22.1 million people reported African American alone and 24.6 million people reported African American alone or in any combination. The Sub-Saharan alone or in any combination population totaled 2.8 million. The Caribbean alone or in any combination population totaled 2.6 million.
Hispanic or Latino: The Mexican population (35.9 million) was the largest detailed Hispanic origin group in 2020, followed by Puerto Rican at 5.6 million and Salvadoran at 2.3 million. Detailed Hispanic origin data reveal the Colombian (1.3 million) and Honduran (1.1 million) populations topped one million for the first time. The Venezuelan population grew the fastest of all detailed Hispanic origin groups, almost tripling to 605 thousand in 2020.
Middle Eastern and North African: MENA was included in the 2020 census for the first time. The Lebanese (685.7 thousand), Iranian (568.5 thousand), and Egyptian (396.9 thousand) alone or in any combination populations represented nearly half of the 3.5 million respondents who reported a Middle Eastern and North African (MENA) response.
American Indian and Alaska Native: Among all American Indian and Alaska Native groups, Aztec (387.1 thousand) was the largest alone group and Cherokee (1.5 million) the largest alone or in any combination group in 2020. Tlingit the largest Alaska Native alone or in any combination group (22.6 thousand).
Some Other Race: The majority (93.9%) of the 27.9 million respondents classified as Some Other Race alone were of Hispanic or Latino origin. The Some Other Race population also includes people who reported “Multiracial and Multiethnic” terms, such as “Biracial,” to the race question.
Note from the U.S. Census: Comparisons between the 2020 Census and 2010 Census detailed race data should be made with caution and take into account improvements made to the race question and to the way the Census Bureau codes responses. The detailed Hispanic origin data from the ethnicity question are comparable between the two censuses.
Helpful Resources:
U.S. Census Asian Population: 2020 Census Detailed Demographic and Housing Characteristics File A on America Counts
U.S. Census Overview of Race and Ethnicity: 2020 Census Detailed Demographic and Housing Characteristics File A on America Counts
Get a monthly dose of our latest insights!


About
myasianvoice
At MyAsianVoice, we make disaggregated U.S. Asian data visible and accessible.
Subscribe to receive our latest insights >>