Government, Resources
Vastly underrepresented: Appointments of Asian Californians made by the Governor’s Office
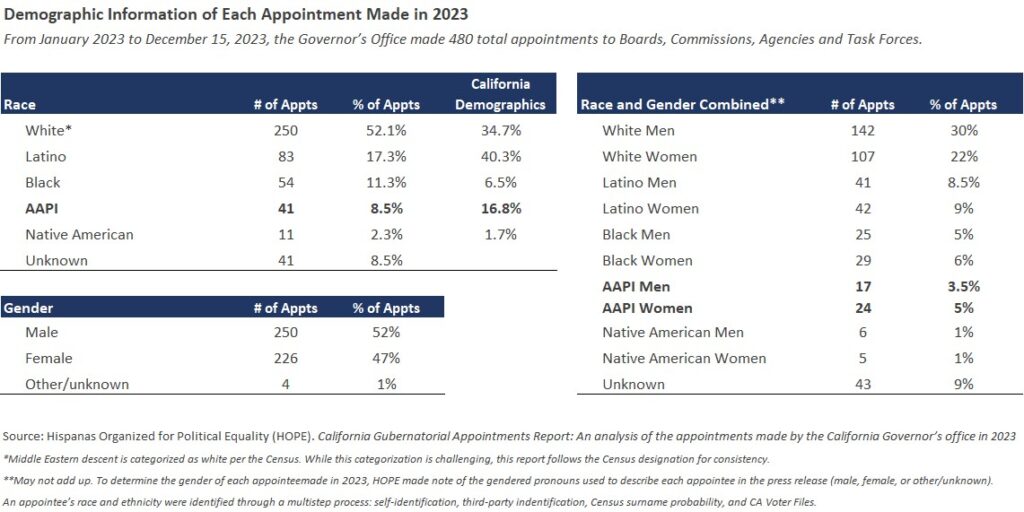
California is home to more than 6 million Asian American and Pacific Islanders (AAPIs). AAPIs make up 16.8% of California’s total population, yet only 8.5% of appointees made by the Governor’s Office to California’s boards, agencies, commissions, and task forces – a 49% underrepresentation. Per a recent analysis of the 480 total appointments made in 2023, 41 were to AAPIs, 250 to Whites, 83 to Latinos, 54 to Blacks, and 11 to Native Americans, with 41 of unknown race. More women of color were appointed than men of color, while more White men were appointed than White women.
California is home to more than 6 million Asian American and Pacific Islanders (AAPIs). AAPIs make up 16.8% of California’s total population, yet only 8.5% of appointees made by the Governor’s Office, a 49% underrepresentation. This key finding was released in an analysis by the nonprofit Hispanas Organised for Political Equality (HOPE), in response to an October 2022 veto of SB702, a bill which require the Governor to create and publish an annual report on “aggregate demographic information” of appointments made to California’s boards, agencies, commissions, and task forces.
Appointment demographics
Of the 480 total appointments made by the Governor’s Office from January 2023 to December 15, 2023, there were 41 AAPIs appointees, 24 (5.0%) were women and 17 (3.5%) were men.
While the total appointments moved closer to gender parity, more women of color were appointed than men of color, and more White men were appointed than White women.
AAPIs and Latinos are vastly underrepresented.
White and Black Californians are overrepresented when compared to California’s overall demographic diversity. AAPIs and Latinos are vastly underrepresented. White Californians hold the majority of appointments at 52.1%. Latino (17.3%), Black (11.3%), AAPI (8.5%), and Native American Californians (2.3%) collectively make up 39.4%, with the remainder of unknown race. California’s demographic population includes 34.7% Non-Hispanic White, 40.3% Hispanic or Latino, 6.5% Black, 16.8% AAPI, and 1.7% Native American per the latest U.S. Census.
Continued tracking
HOPE intends to continue tracking appointments in 2024. Senator Monique Limón (D-19) introduced SB702. She believes that you can not fix what you cannot see. If Californian leadership does not evaluate its progress, gaps in representation will continue to exist.
Helpful Resource
California Gubernatorial Appointments Report: An analysis of the appointments made by the California Governor’s office in 2023 (Hispanas Organized for Political Equality [HOPE])
Get a monthly dose of our latest insights!


About
myasianvoice
At MyAsianVoice, we connect Asian Americans to surveys and research to bridge the Asian data gap.
Join our growing respondent list >>