The Asian American homeownership rate has hit a new high at 63% in 2022 and is varied across Asian subgroups. For people of color and multiracial Americans, homeownership rates improved from 2010 to 2022, but still lag the national rate. Diving deeper into the profile of Asian homebuyers, they are significantly likely to be married (65%), have at least a bachelor’s degree (88%), and live in multi-earner households (69%). Differences by race and ethnicity exist in the sources of down payment, type of homes purchased, and reasons for loan denials. Separately, international homebuyers accounted for 2.3% ($53.3B) of total existing home sales and purchased 1.8% (84.6K) of all existing homes sold from April 2022 to March 2023. Buyers from China and India are among the top 5 countries of origin. Where Chinese and Indian buyers choose to buy and how they use their purchased property differ.

What is the homeownership by race?
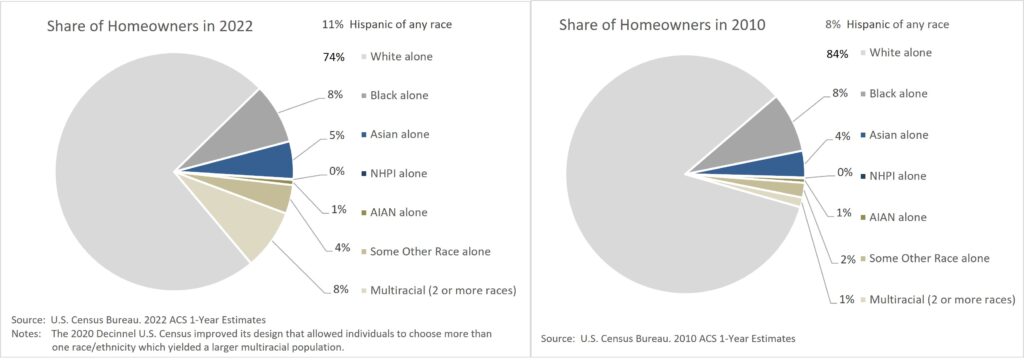
After more than a decade (2010 to 2022), homeownership is diversifying. In 2022, homeowners of color make up 26% of all homeowners in the United States, up from 16% in 2010. A large shift was by multicultural Americans. Beginning with the 2020 Decennial U.S. Census, Americans were able to choose more than one race/ethnicity that resulted in a larger reported multicultural population. Hispanic Americans of any race (11%) and Asian Americans (5%) also experienced gains as their share rose by 3% and 1%, respectively.
Homeownership rate gains by race and ethnicity
The Asian American homeownership rate has hit a new high at 63% in 2022 per the latest U.S. Census, but is varied across Asian subgroups. For people of color and multiracial Americans, the homeownership rate improved from 2010 to 2022, however the homeownership rate of Black Americans remained flat at 44%. While more people of color became homeowners, their respective homeownership rates still lag the national rate of 65% and significantly below that of the White homeownership rate of 72%.
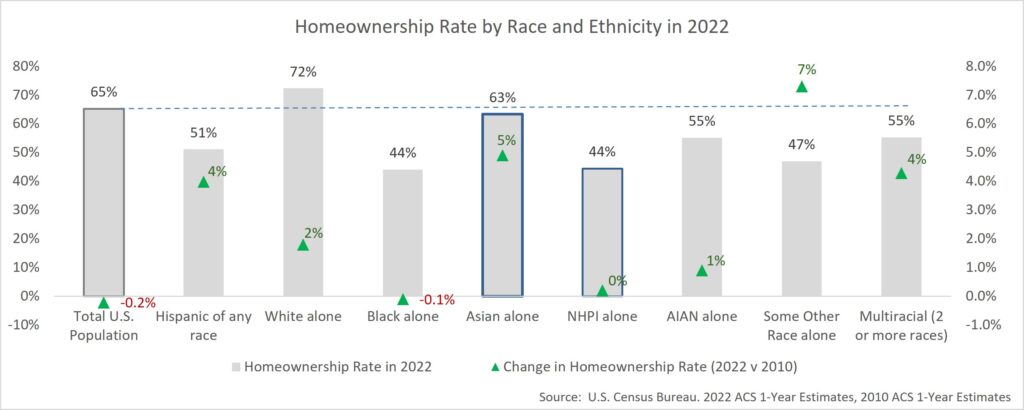
According to the National Association of Realtors (NAR), there were 10.5 million new homeowners in the U.S. in 2022, but housing affordability, access to credit, rising student loan debt, and additional obstacles continue to challenge homebuyers of color in a disproportionate way. Still, Asian, Hispanic, and multicultural Americans experienced the largest homeownership rate gains in more than a decade. Asian Americans saw a 5% increase over 2010. Hispanic and multicultural Americans saw a 4 % increase each over the same period.
Under-representation of homebuyers of color
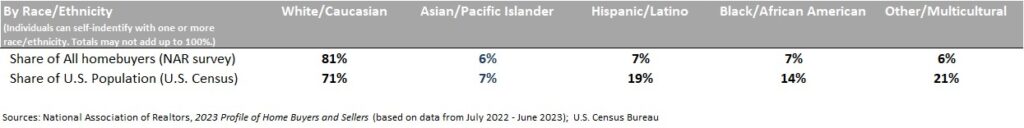
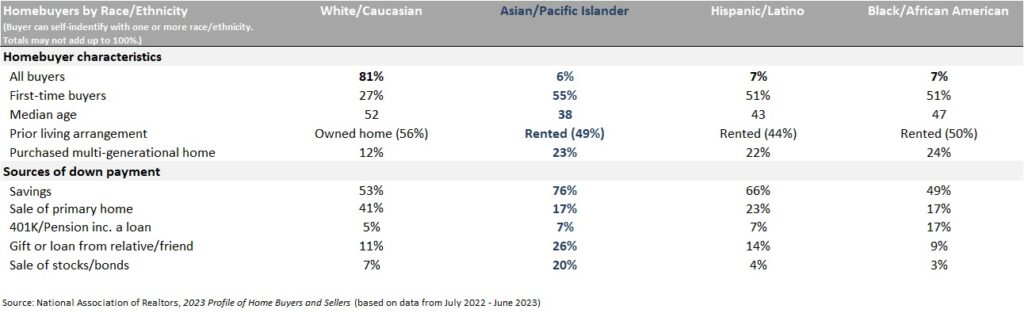
The profile of homebuyers continues to show under-representation for people of color in the U.S. Census and in NAR’s recent 2023 Profile of Home Buyers and Sellers survey. NAR’s survey includes homebuyers and homesellers who completed a transaction between July 2022 and June 2023. Of all homebuyers who were surveyed, 81% identified as White, 7% Hispanic, 7% Black, 6% Asian, and 6% of Other race. The U.S. population is 71% White, 19% Hispanic of any race, 14% Black, 7% Asian and 21% Other/multicultural races (individuals can identify with one or more races/ethnicity, these figures may not add up to 100%).
What is the profile of Asian American homebuyers?
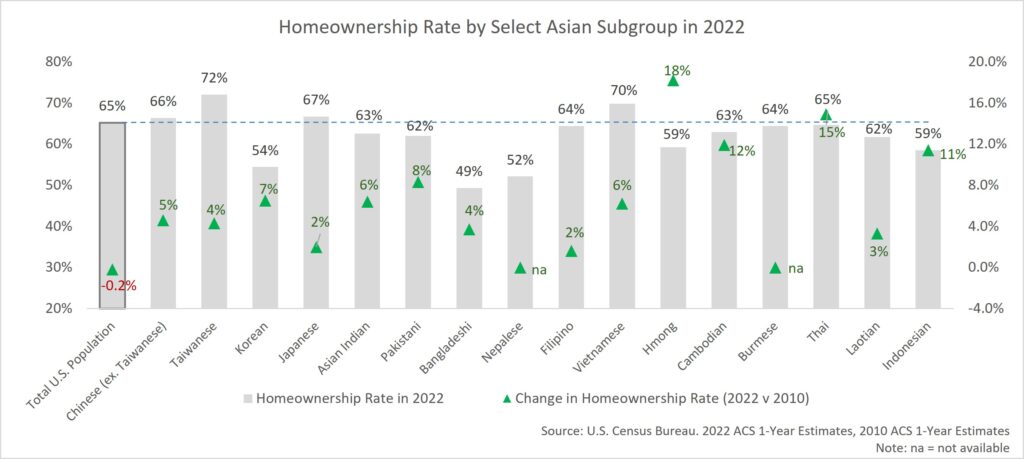
Asian Americans have made progress in moving their homeownership rate closer to the national rate, a 5% gain from 58% in 2010 to 63% in 2022. This progress varied by Asian subgroup. Homeownership rates ranged from 49% for Bangladeshis to 72% for Taiwanese Americans. Hmong (+18%), Thai (+15%), Cambodian (+12%), and Indonesian (+11%) Americans attained the largest homeownership rate gains.
Homebuying skews toward upper-income Americans
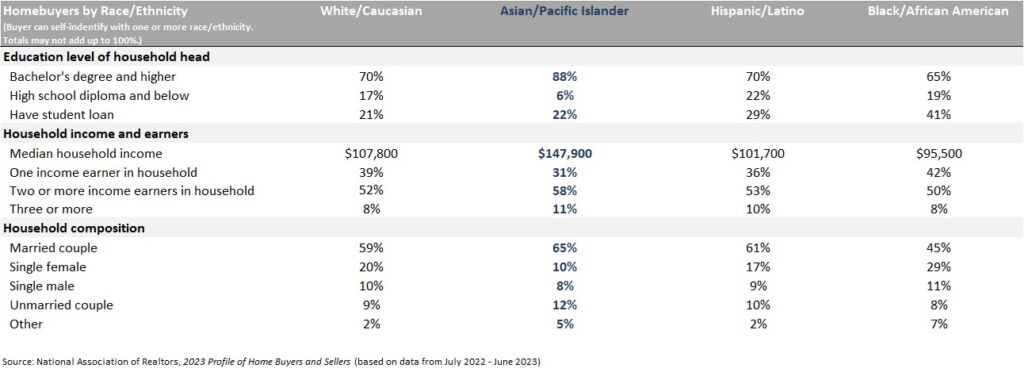
Diving deeper into the profile of Asian homebuyers, they are significantly likely to be married (65%), have at least a bachelor’s degree (88%), and live in multi-earner households (69%) – factors that likely explain their high household income. Only 6% of Asian homebuyers have a high school diploma and below compared to 24% of Asians with the same education nationally. Across all races and ethnicity, homebuyer median household income is notably higher than the national median household income of $75K and the percentage of homebuyers with at least a bachelor’s degree is significantly higher than the national level of 36%.
Sources of down payment differ by race and ethnicity
A half of Asian homebuyers were first-time buyers, and half were renters prior to their purchase. Asian homebuyers tend to be younger with a median age of 38 compared to the median age of 52 for White, 47 for Black, and 43 for Hispanic homebuyers. 23% of Asian homebuyers, 24% of Black, and 22% Hispanic homebuyers, bought multi-generational homes as compared to 12% of White homebuyers. Asian homebuyers are most likely to use their savings (76%) and/or receive a gift or loan from relative/friends (26%) as sources of down payment, while White homebuyers are most likely to use their savings (53%) and/or money from the sale of their primary home (41%) as sources of down payment.
Financing barriers exist across racial and ethnic groups
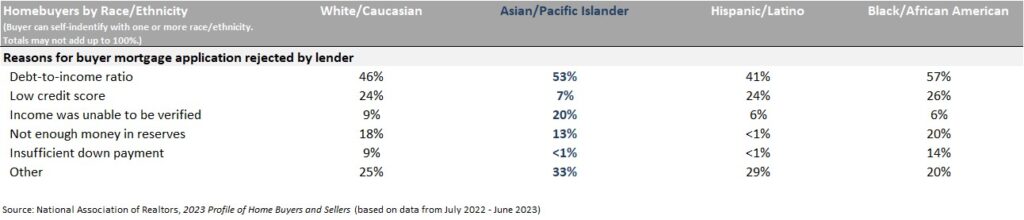
80% of all homebuyers financed their home purchase. For prospective home buyers, the top reason for their loan denial was debt-to-income ratio, but financing barriers exist across racial and ethnic groups. Prospective Asian buyers were more likely to be denied financing for being unable to verify their income. This contrasts with prospective Black, Hispanic, and White buyers who were more likely to be denied due to low credit scores.
Loan denial rates by state
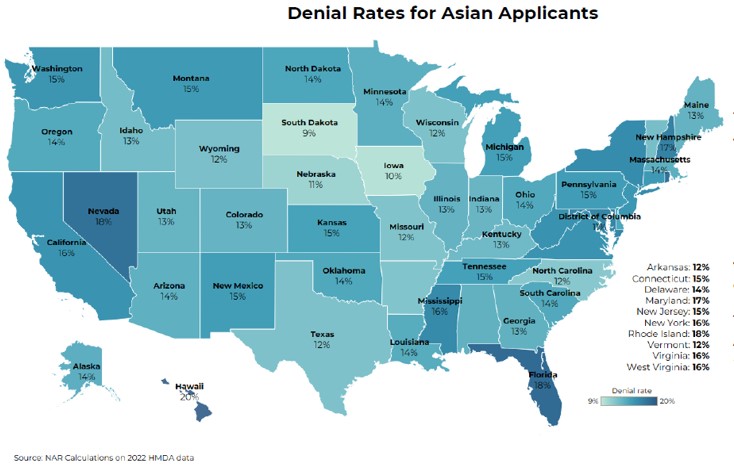
By state, the loan denial rates for Asian Americans varied from 9% to 20% across the country. Among the 50 states and the District of Columbia, 15 states had a denial rate for Asian Americans higher than the national rate of 15% in 2022. The highest denial rates were in Hawaii (20%), Florida (18%), and Nevada (18%) – states with their Asian (alone and in combination) population representing 57%, 4%, and 11% of each state’s population, respectively.
What is the profile of international buyers from Asia?
According to NAR’s 2023 Profile of International Transactions in U.S. Residential Real Estate survey, which represents transactions with international clients who purchased and sold U.S. residential property during the 12-month period of April 2022 to March 2023, international buyers accounted for $53.3 billion or 2.3% of all existing home sales ($2.3 trillion). They bought 84,600 existing homes or 1.8% of all existing homes sold over the same period.
NAR defines an international or foreign buyer as a nonresident who is a non-U.S. citizen with a permanent residence outside the U.S., or a resident who is a non-U.S. citizen recent immigrant (less than 2 years at the time of the transaction), or a non-immigrant visa holders who reside for more than six months in the U.S. for professional, educational, or other reasons.
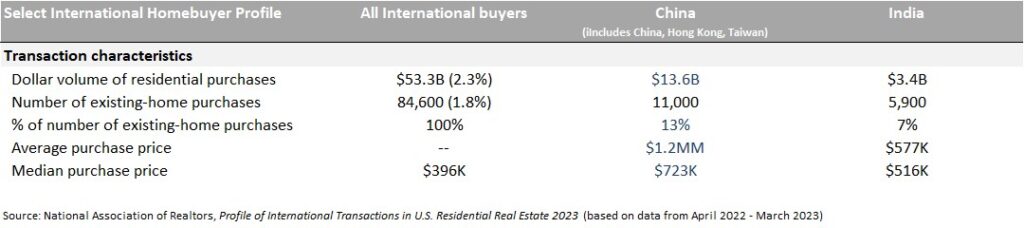
International buyers from China (defined to include China, Hong Kong, and Taiwan) and India are among the top 5 countries of origin and accounted for 13% and 7% of number of homes purchased, respectively. Chinese buyers spent $13.6 billion on existing homes during this period, but significantly down from 2014 through 2018, where Chinese buyers spent more than $20 billion on existing U.S. homes per year according to NAR data. In recent years, many states, in mostly Republican states, such as Florida and Texas, have enacted or proposed restrictive land bills on international buyers from China.
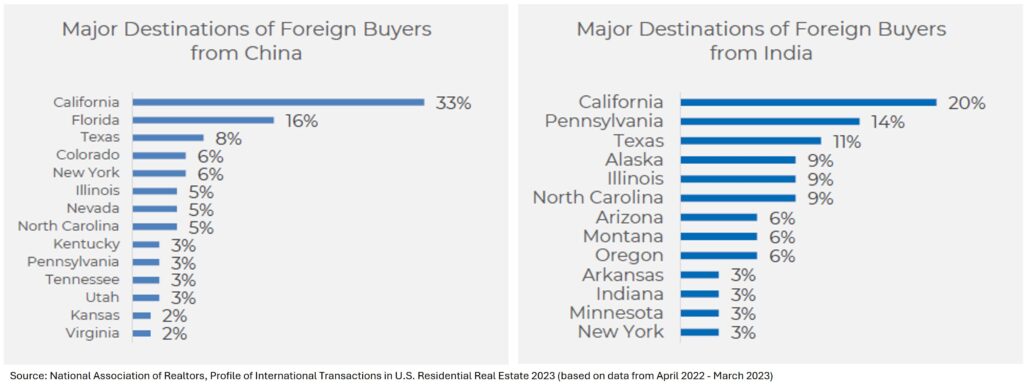
California tops the list for buyers from China and India
One-third of home purchases were in California, followed by Florida (16%), and Texas (8%) for buyers from China. One-fifth of home purchases were in California, followed by Pennsylvania (14%), and Texas (11%) for buyers from India.
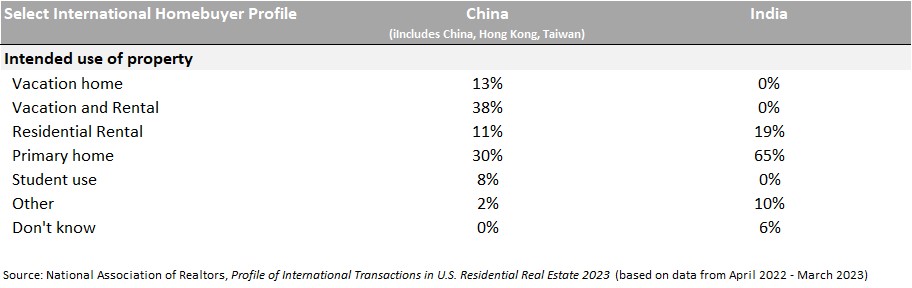
Intended use of property
For Indian homebuyers, 65% intend to use the home as their primary residence, and 19% intend to use it as a residential rental. For Chinese homebuyers (people from China, Hong Kong, and Taiwan), 30% intend to use the home as their primary residence, and over 60% intend to use it as a vacation home, residential rental, or both. 8% of buyers from China intend for the home to be student use.
***
This article contains original analysis and content developed by MyAsianVoice based on primary data published by third parties. While the underlying data may be publicly available, all insights, visualizations, and derived content, unless otherwise noted, are the intellectual property of MyAsianVoice and are protected under international copyright and intellectual property laws. If you use, reference, or cite any part of our analyzed data or content, you must provide full proper attribution. Required citation include: MyAsianVoice’s full name, title of the article, and direct link to the article.
Useful Resources
Snapshot of Race and Home Buying in America (The National Association of Realtors)
2023 Profile of International Transactions in U.S. Residential Real Estate (The National Association of Realtors)
2024 State of Asia America Report (Asian Real Estate Association of America)
Get a monthly dose of our latest insights!


About
myasianvoice
At MyAsianVoice, we make disaggregated U.S. Asian data visible and accessible.
Subscribe to receive our latest insights >>