Asian Americans make up roughly 8% of all U.S.workers aged 16 or older. Per the U.S. Bureau of Labor Statistics (BLS)’s 2025 data, their employment patterns reveal the diversity of occupations and insights that go beyond stereotypes. While Asian Americans are often associated with high-paying jobs, the data show a more nuanced picture. Asian Americans are overrepresented in high-skilled professional fields like technology and healthcare, but many also work in essential but lower-paying service roles. Moreover, jobs in education and service are dominant for many Asian subgroups. These patterns reflect a complex mix of immigration history, educational attainment, and U.S. policy, rather than a single narrative of success.

Asian Americans make up roughly 8% of all U.S.workers aged 16 or older. According to the 2025 data by the U.S. Bureau of Labor Statistics (BLS), their employment patterns reveal the diversity of occupations and insights that go beyond stereotypes.
Common jobs and occupations of Asian Americans
In 2025, over 12 million Asian Americans aged 16 or older were employed across a wide range of occupations. The top 15 most common jobs among them include both professional and service roles. The most common occupation was software developer, with an estimated 897,000 Asian American workers. Registered nurses ranked second with 374,000, followed by other physicians (237,000), accountants and auditors (224,000), and first-line supervisors of retail sales workers (217,000) to round out the top 5.
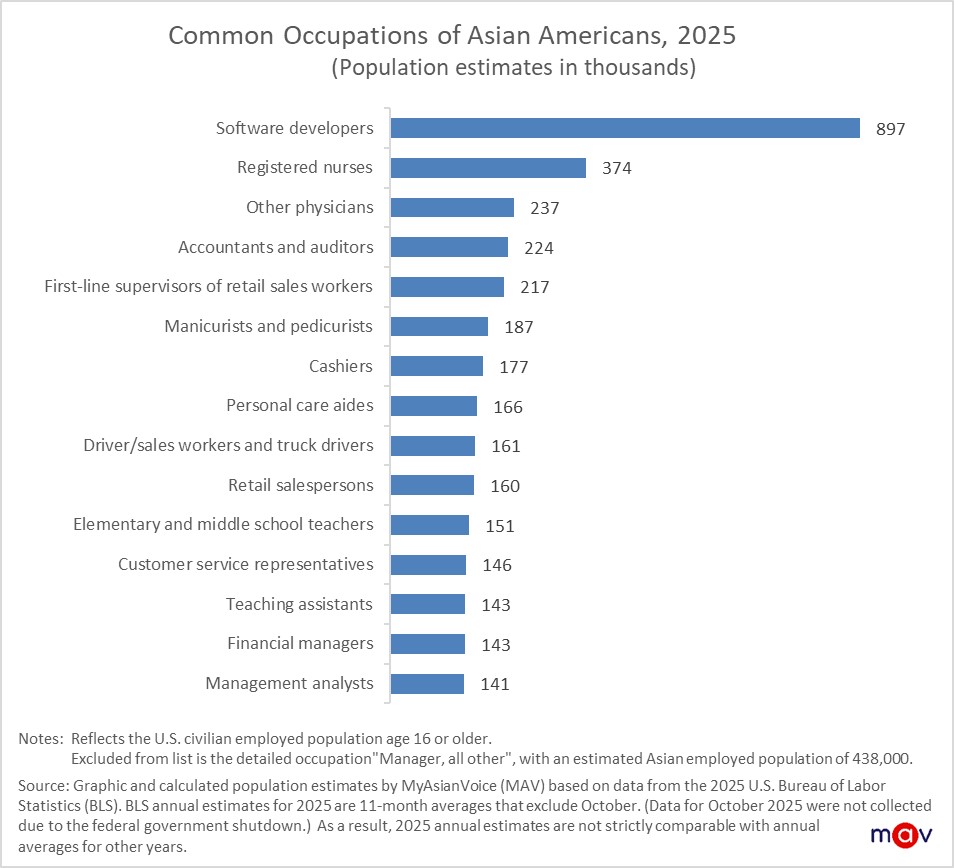
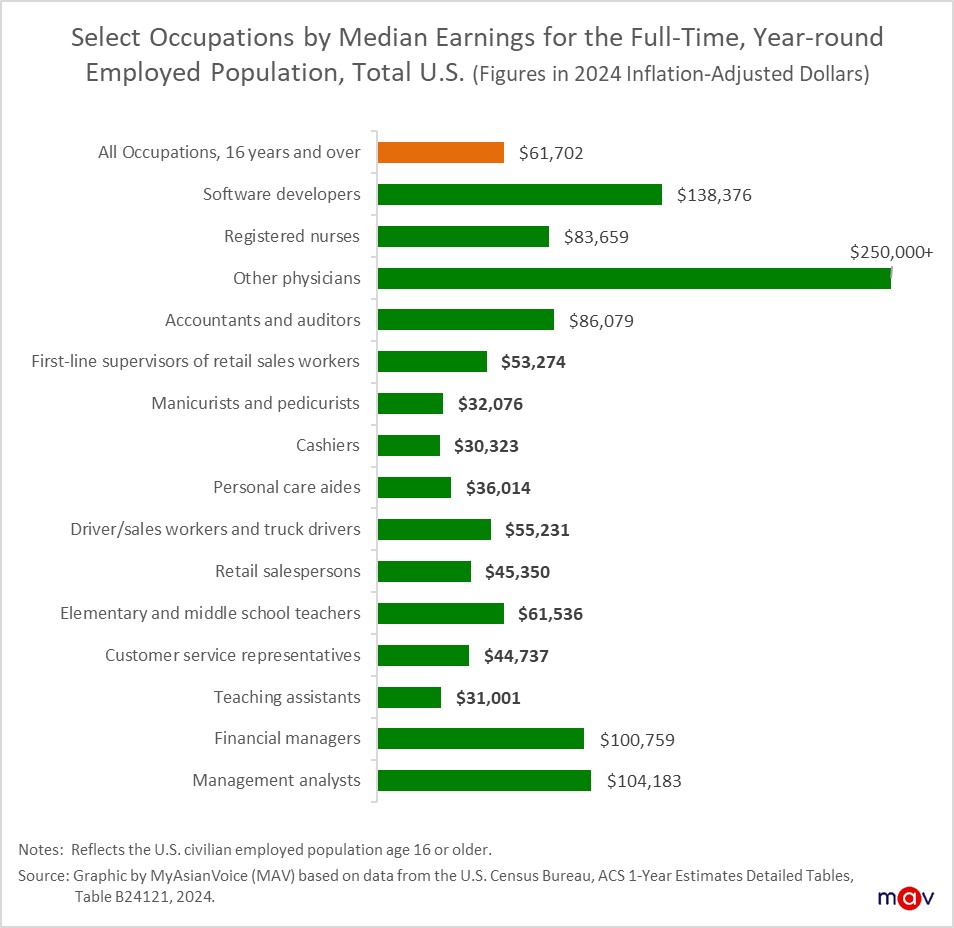
Although Asian Americans are often associated with high-paying jobs, the data show a more nuanced picture. Many of the top 15 common occupations are actually in lower-paying service and transportation roles—such as manicurists and pedicurists, cashiers, personal care aides, drivers/sales workers and truck drivers, retail salespersons, customer service representatives, and teaching assistants.
Jobs and occupations with the highest Asian representation
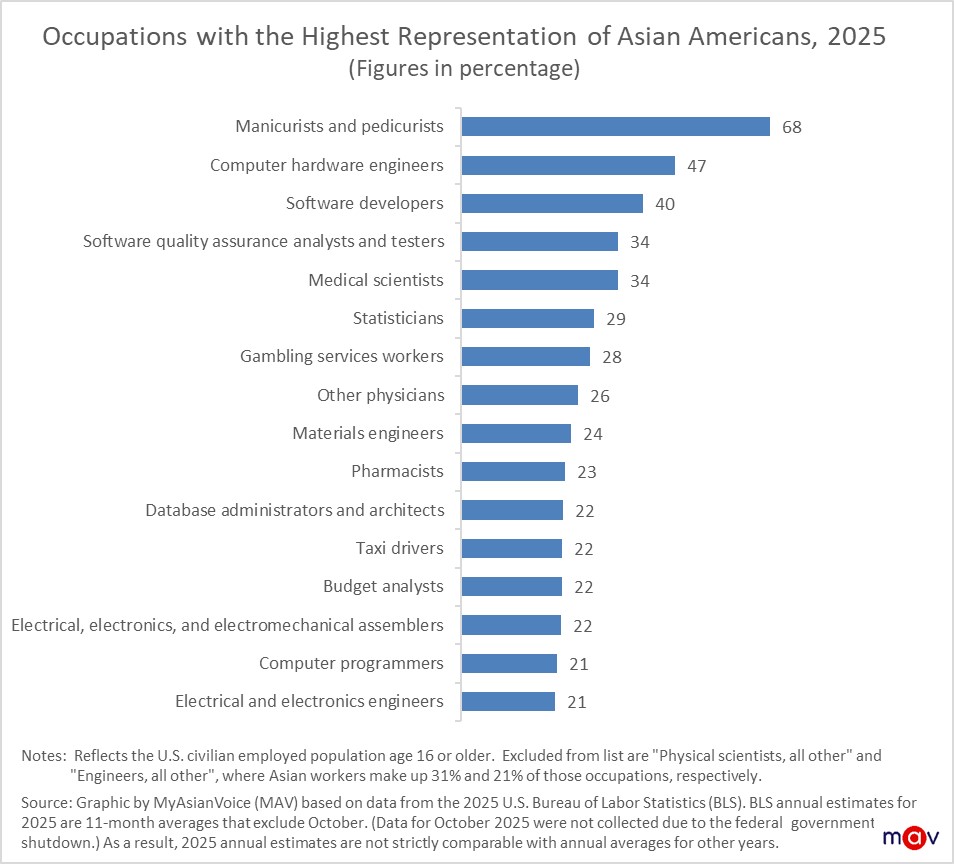
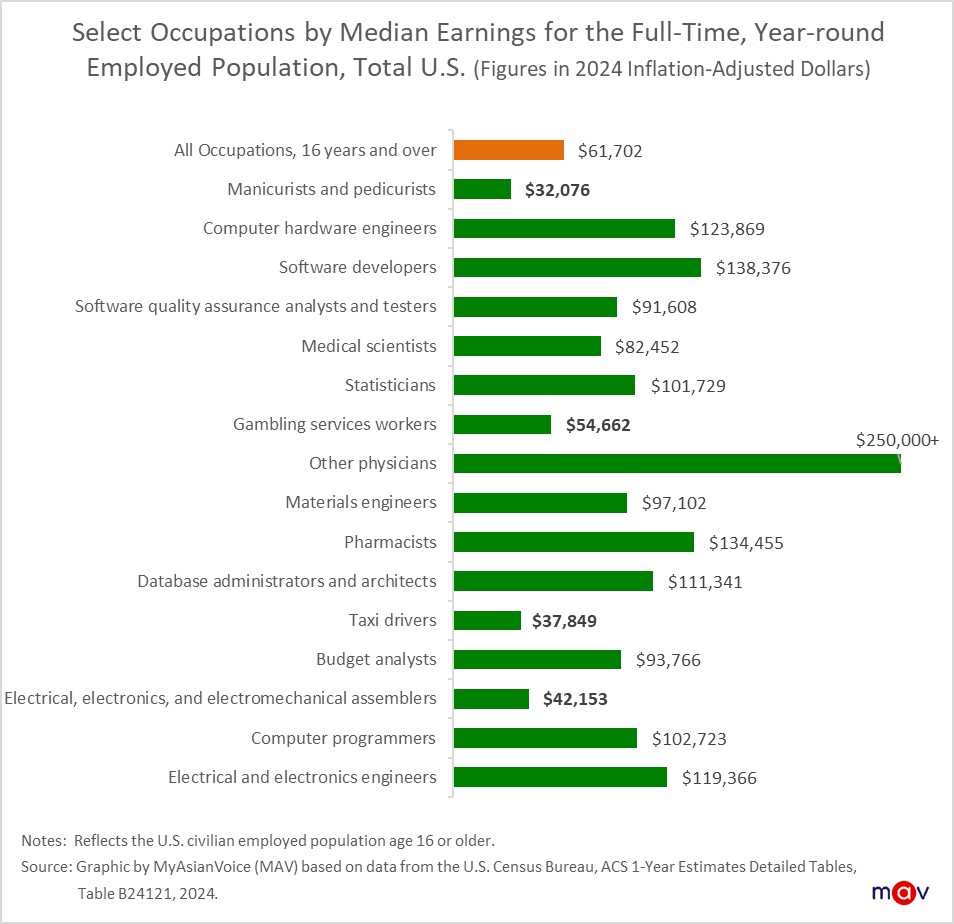
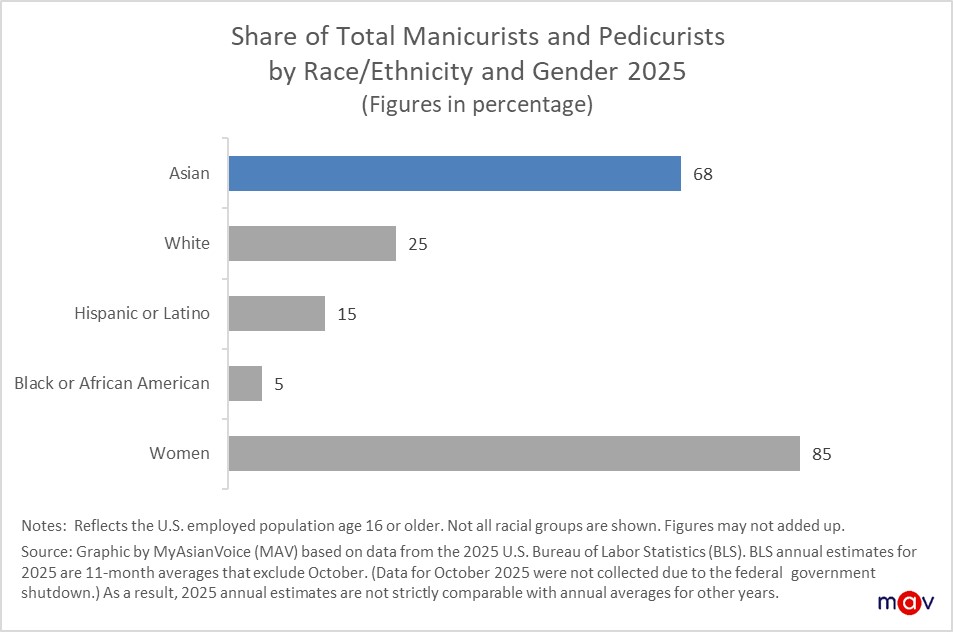
Existing narratives about Asian American employment often highlight jobs with the highest Asian representation—defined as the share of Asian workers within a specific occupation—which frequently points to high-paying technology and medical fields. However, the occupation with the highest share of Asian workers is manicurists and pedicurists at 68%, a relatively low-paying job. In other words, nearly 7 out of 10 manicurists or pedicurists in America are Asian. Other low-paying occupations with high Asian representation include gambling service workers at 28%, taxi drivers at 22%, and electrical, electronics, and electromechanical assembers also at 22%.
Common jobs and occupations by Asian subgroup
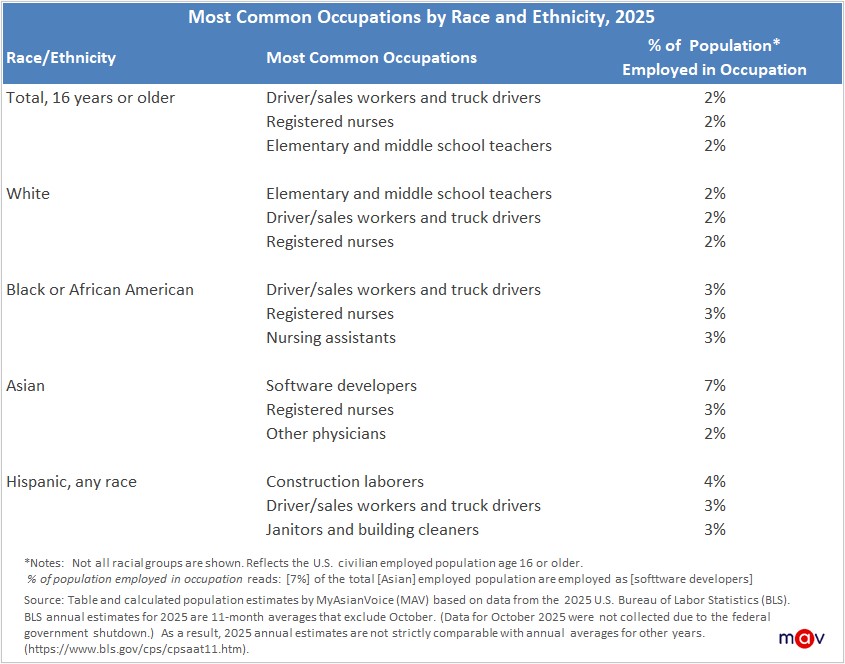
Across the broader U.S. workforce, the most common jobs differ by race and ethnicity. BLS data show that the most common jobs for all Americans are driver/sales workers and truck drivers, registered nurses, and elementary and middle school teachers. Each of these professions constitute roughly 2% (over 3.5 million) and a combined 6% (10.6 million) of the overall U.S. workforce.
Among Asian Americans, software developer is the most common occupation, accounting for 7% of the Asian workforce. White Americans are most likely to work as elementary and middle school teachers, Black Americans as driver/sales workers and truck drivers, and Hispanic Americans as construction workers.
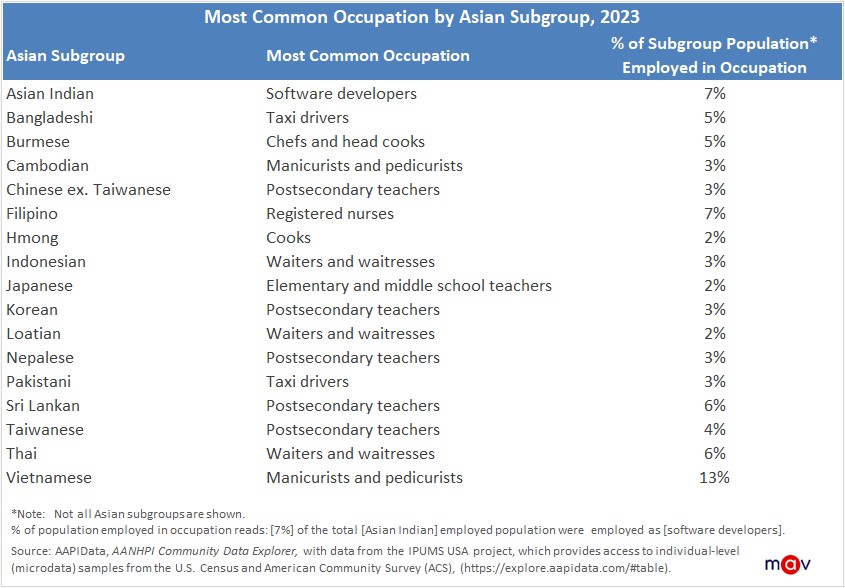
While software developer is the most common job among Asian Americans overall, it hides significant variation among Asian subgroups. For instance, software developer is the most common occupation among Indian Americans, reflecting both the influence of the U.S. government’s H-1B visa program and India’s large export of tech talent globally. For other Asian subgroups, the employment landscape looks quite different.
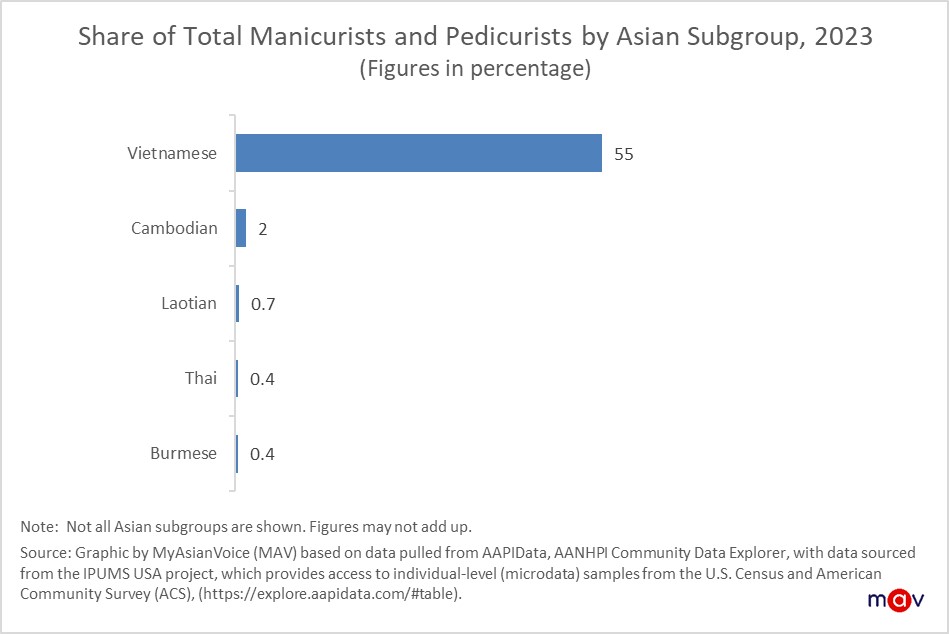
Jobs in education and service are dominant for many Asian subgroups per available U.S. Census microdata through AAPIData. Manicurist and pedicurist is the most common occupation among Vietnamese Americans, making up 13% of the total Vietnamese workforce. Postsecondary teacher ranks highest among Chinese, Taiwanese, Korean, Nepalese, and Sri Lankan Americans, while taxi driver is the most common job among Bangladeshi and Pakistani Americans. Southeast Asian Americans are more likely to work in food service as waiters and waitresses (Indonesian, Laotian, and Thai), cooks (Hmong), or chefs and head cooks (Burmese). Filipino Americans stand out in healthcare, with registered nurse being their most common occupation, reflecting the Philippines’ role as a major exporter of nursing talent to the U.S. and the world.
Software developers
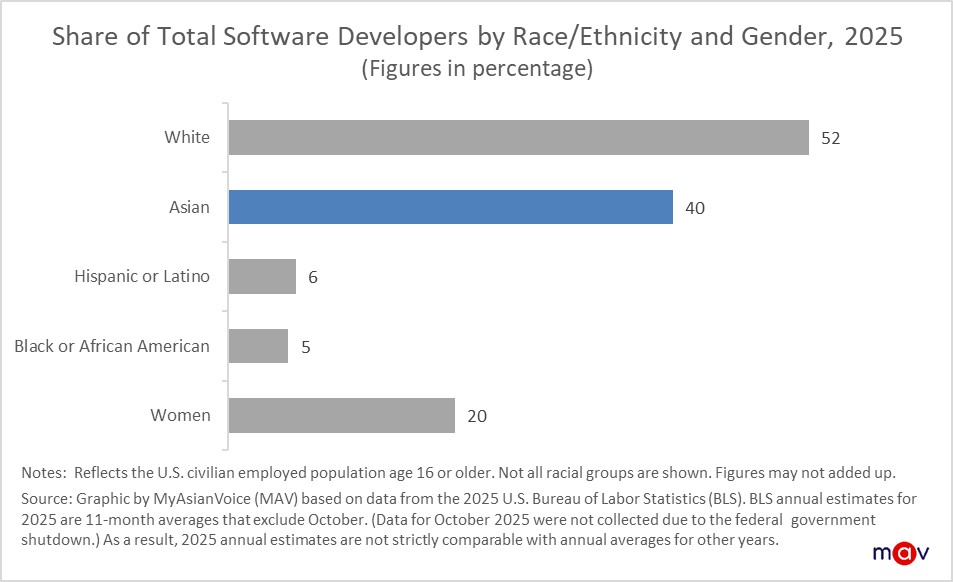
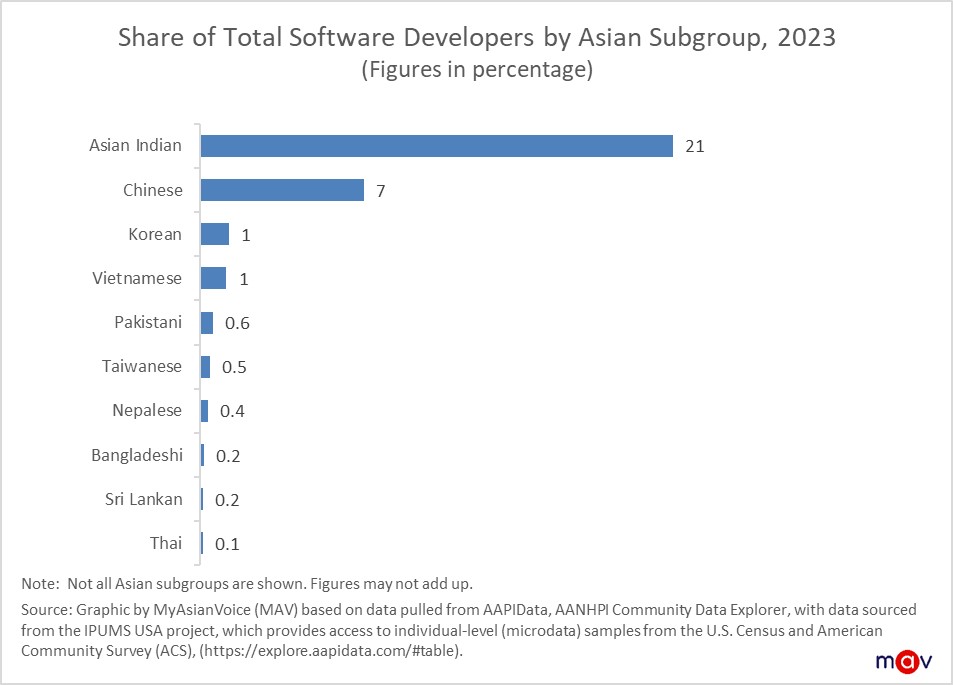
Over 2.2 million Americans aged 16 or older worked as software developers in 2025. Asian workers accounted for 40% of all software developers, a figure shaped by U.S. immigration policy favoring highly skilled workers since 1965 and the creation of the H-1B program in 1990. For many years, over 70% of H-1B visas have gone to workers from India, resulting in 1 in every 5 software developers is of Indian descent today. The field is also heavily male-dominated, with men making up 80% of all software developers. Among the 50 U.S. states, the largest Asian software developer populations are concentrated in California, Washington, and Texas.
Manicurists and pedicurists
There were 277,000 manicurists and pedicurists nationwide in 2025, according to the BLS; however, the actual number may be much higher, as many work part-time or have variable schedules and therefore may not be counted. 68% of manicurists and pedicurists identified as Asian—mostly Vietnamese Americans, who make up over half of all workers in this field. The field is also heavily women-dominated, with women accounting for 85% of manicurists and pedicurists. The largest populations of Asian manicurists and pedicurists are found in California, Texas, and Florida.
The most common jobs and occupations of Asian Americans reveal the economic diversity and the limits of Asian stereotypes. While Asian Americans are overrepresented in high-skilled professional fields like technology and healthcare, many also work in essential but lower-paying service roles. These patterns reflect a complex mix of immigration history, educational attainment, and U.S. policy, rather than a single narrative of success. Understanding this offers a more realistic view of Asian Americans’ contributions to the U.S.
***
This article contains original analysis and content developed by MyAsianVoice based on primary data published by third parties. While the underlying data may be publicly available, all insights, visualizations, and derived content, unless otherwise noted, are the intellectual property of MyAsianVoice and are protected under international copyright and intellectual property laws. If you use, reference, or cite any part of our analyzed data or content, you must provide full proper attribution. Required citation include: MyAsianVoice’s full name, title of the article, and direct link to the article.
Helpful Resources
Employed people by detailed occupation, sex, race, and Hispanic or Latino ethnicity (U.S. Bureau of Labor Statistics)
AANHPI Community Data Explorer (AAPIData)
Get a monthly dose of our latest insights!


About
myasianvoice
At MyAsianVoice, we make disaggregated U.S. Asian data visible and accessible.
Subscribe to receive our latest insights >>