Government, Resources, Voices
Party affiliation of Asian voters in CA, NY, and TX
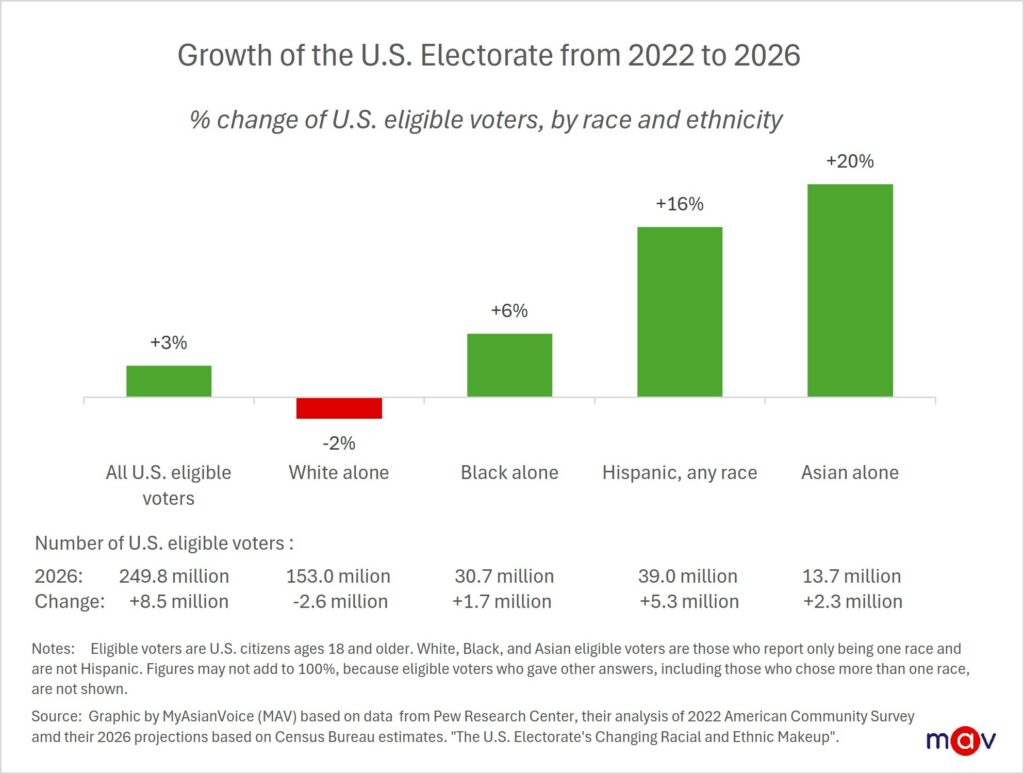
Asian Americans are the fastest-growing racial or ethnic group of eligible voters, according to Pew Research. From 2022 to 2026, their numbers grew by 20% to 13.7 million eligible voters. As the Asian electorate grows, understanding its political preferences becomes increasingly important. That said, little is known about how their party identification varies from state to state. California (CA), New York (NY), and Texas (TX), together represent over 40% of the nation’s eligible Asian American voter population. Asian American voters in California are more likely to identify as Democrats, while their counterparts in Texas show stronger Republican identification. In New York, a substantial independent or unaffiliated population makes the state’s Asian electorate harder to characterize. Asian Americans are not a monolithic voting bloc. Not only do their political affiliations differ by state, but they also vary by subgroup, age, generation, nativity, education, and gender.
Asian Americans are the fastest-growing racial or ethnic group of eligible voters, according to Pew Research. From 2022 to 2026, their numbers grew by 20% to 13.7 million eligible voters. This translates to 2.3 million more Asian eligible voters.
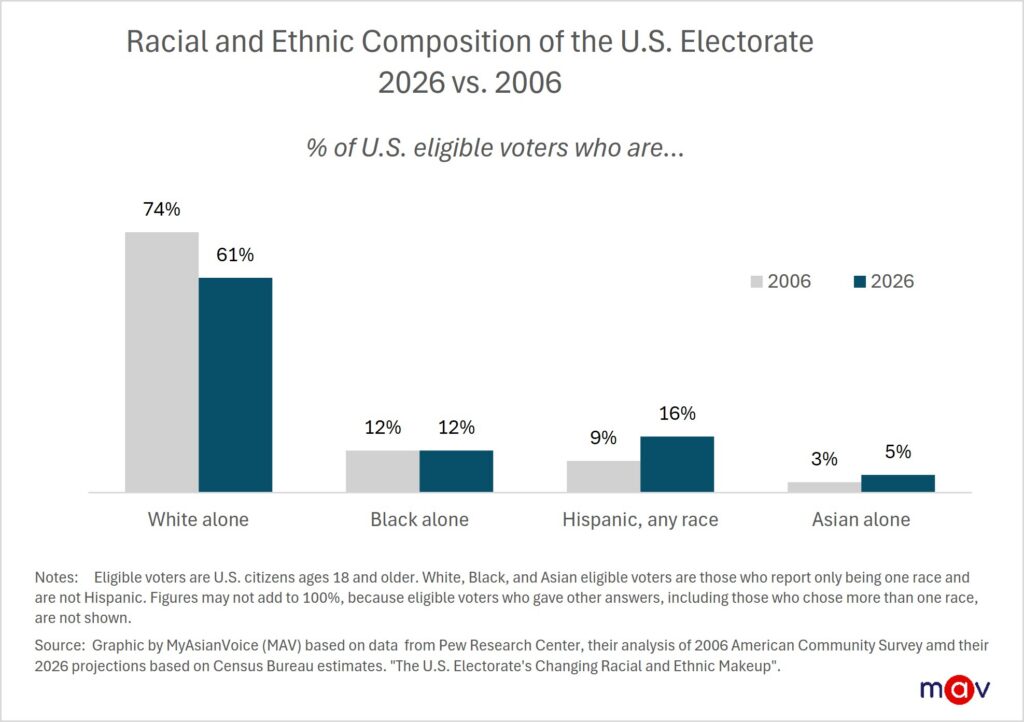
Asian Americans now constitute 5% of the overall U.S. electorate, nearly double from 3% in 2006. As this electorate grows, understanding its political preferences becomes increasingly important.
Political party affiliation
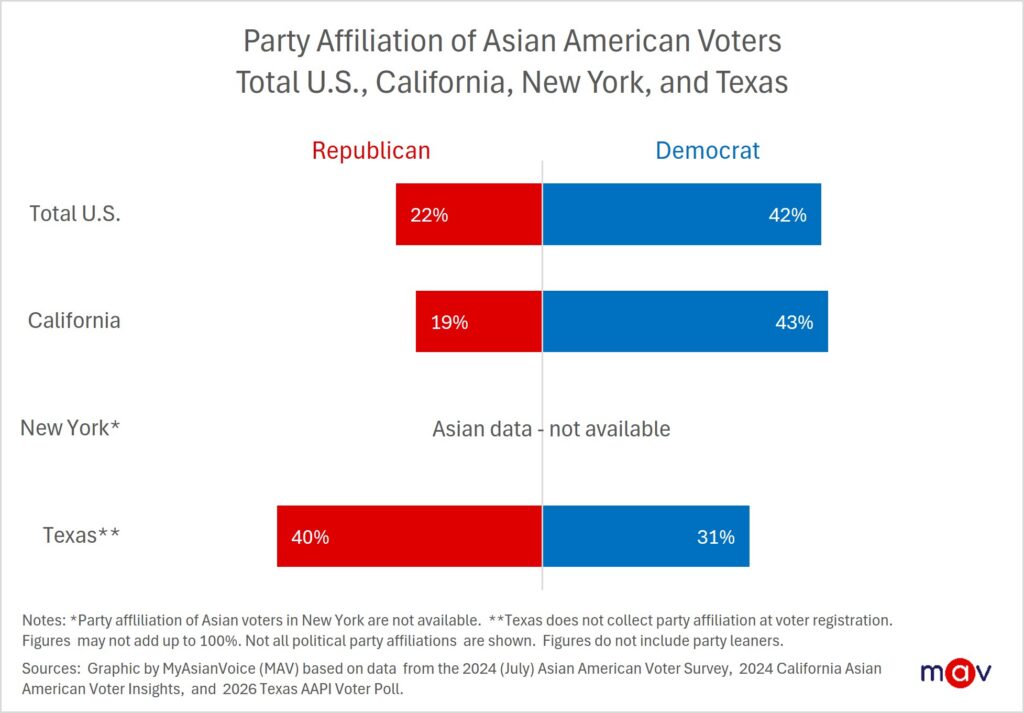
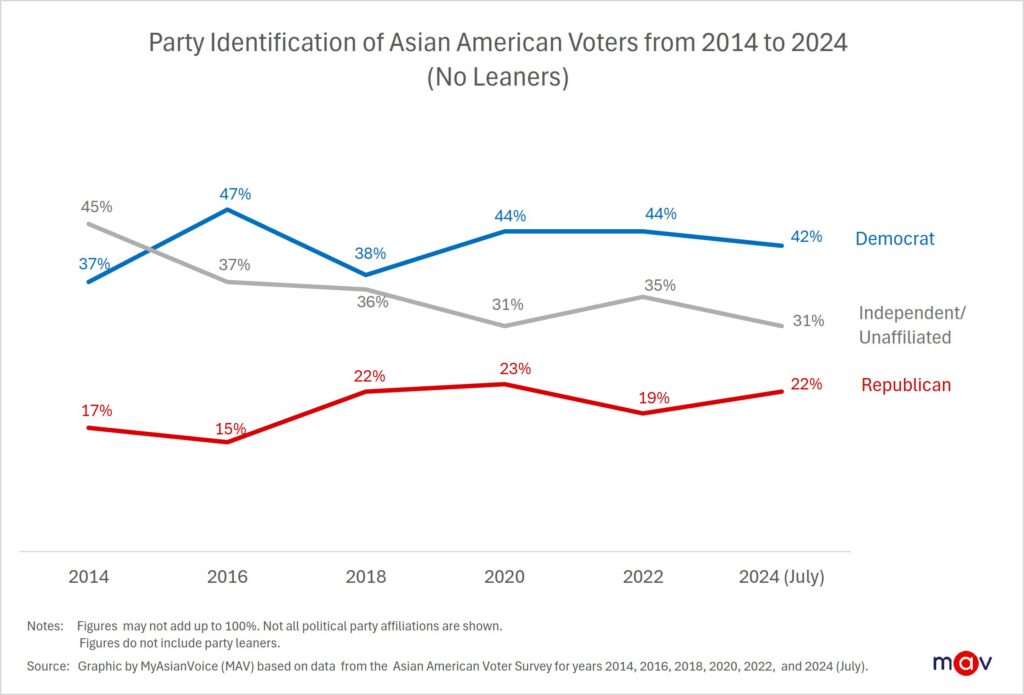
The 2024 Asian American Voter Survey found that 42% of Asian American voters identified as Democrats, 22% as Republicans, and 31% as independents or voters with no strong party preference. These aggregate figures, however, tell only part of the story. Less is known about how their party identification varies from state to state.
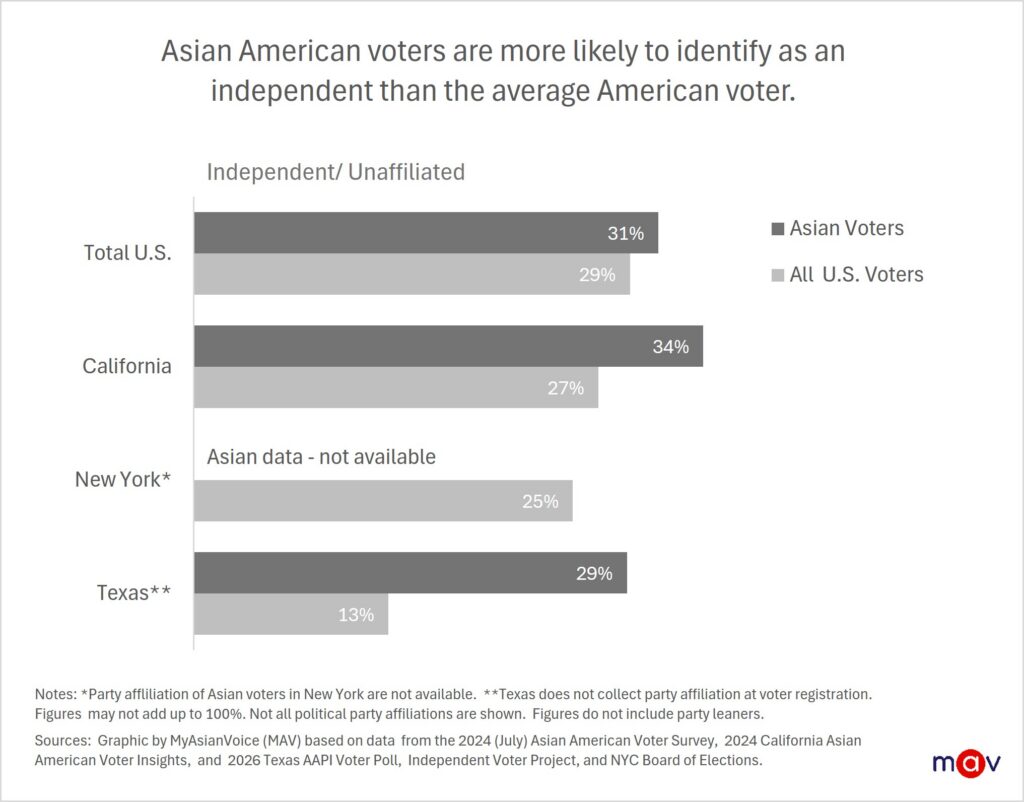
To explore those differences, this article examines California (CA), New York (NY), and Texas (TX), which together represent over 40% of the nation’s Asian electorate. Among these three states, Asian American voters in California are more likely to identify as Democrats, while their counterparts in Texas show stronger Republican identification. In New York, a substantial independent or unaffiliated population makes the state’s Asian electorate harder to characterize.
Significant independent or unaffiliated population
Although Asian American voters generally lean Democratic, a substantial share report no strong attachment to either major party. At 31%, independents or unaffiliated voters remain a significant part of the electorate. Over the past decade, their share has steadily decreased from 45% in 2014 to 31% in 2024.
Shifting party preferences
Asian Americans’ political preferences have also shifted considerably over the past several decades. More than 30 years ago, a majority of Asian Americans voted Republican. Since 2000, more Asian Americans have voted Democratic, marking a broader shift from red to blue.
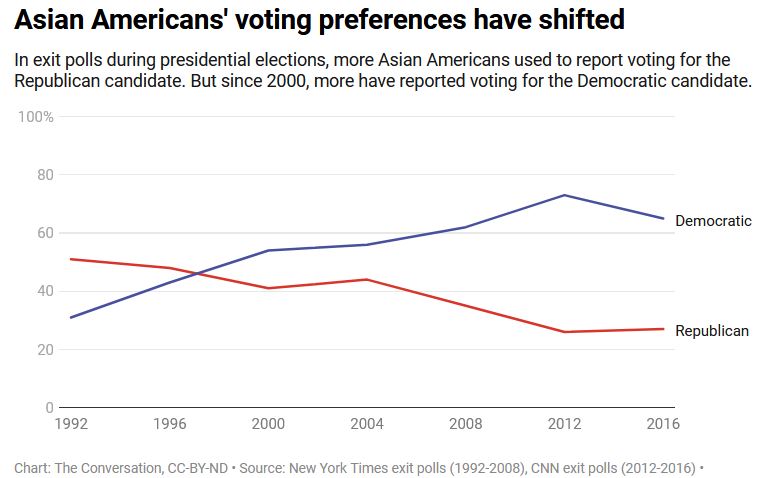
That shift has not followed a straight line. After a large majority supported Democrats in 2020, the 2024 presidential election brought an increase in Republican support among Asian American voters. The pattern is changing again, with more Asian American voters favoring the Democratic Party ahead of the upcoming November midterms. These national shifts provide useful context, but state-level differences reveal why Asian American voters should not be viewed as a single voting bloc.
Asian Californians lean Democratic with differences across subgroups
California is home to the nation’s largest Asian American population and electorate. More than 7 million Asian residents reside in California. They account for approximately 15% to 18% of the state’s total population and represent over a quarter of the nation’s Asian population. Asian Californians are also highly diverse. More than 20 Asian ethnic groups live in California, with Chinese and Filipino forming the largest groups at 1.8 million and 1.7 million, respectively. They are followed by Asian Indians at 900,000, Vietnamese at 800,000, Koreans at 560,000, and Japanese at 470,000.
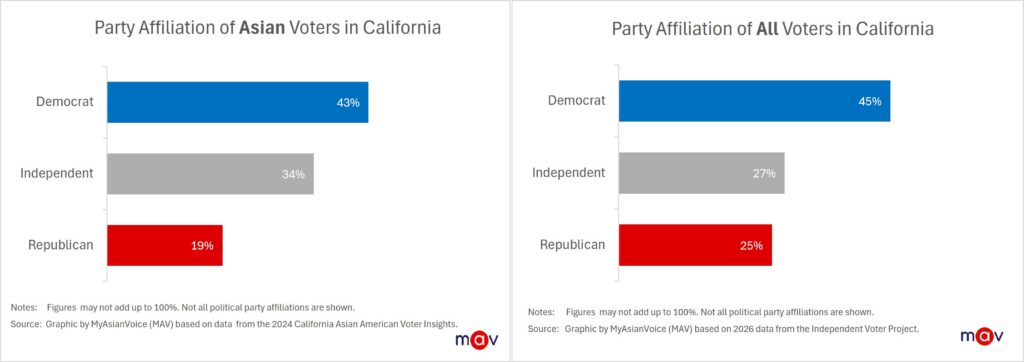
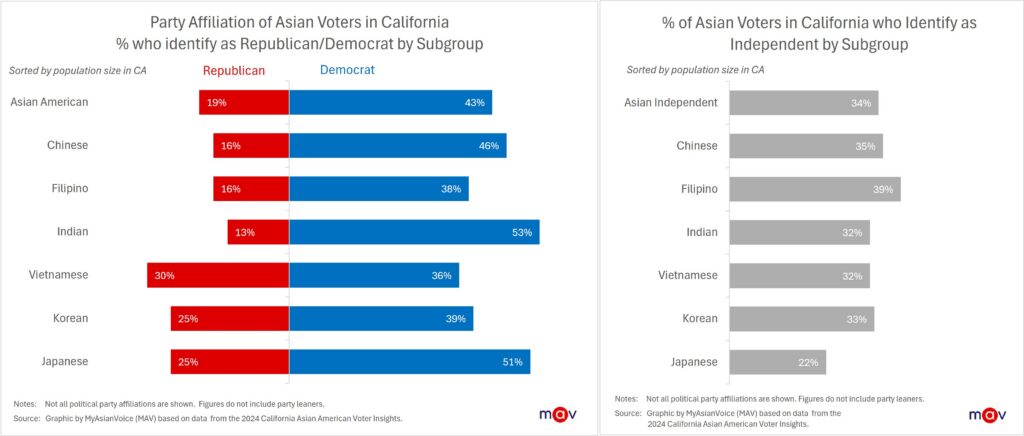
Statewide, the Asian electorate is estimated to be between 4.1 million and 4.5 million, representing a third of the total U.S. Asian electorate and 15% to 17% of California’s overall electorate. Within this large electorate, Democratic identification is most common, but independent identification is also substantial. According to the 2024 California Asian American Voter Insights survey, 43% of Asian Californian voters identified as Democrats, 34% as independents, and 19% as Republicans.
A closer look across ethnic groups reveals important differences masked by the statewide figures:
- Indian voters were most likely to identify as Democrats (53%) and least likely to identify as Republicans (13%), while about a third identified as independents (32%).
- Nearly half (46%) of Chinese voters identified as Democrats and 35% identified as independents.
- Vietnamese voters were divided: 36% identified as Democrats, 30% as Republicans, and 32% as independents.
- Korean voters are also divided, with 39% identifying as Democrats, 25% as Republicans, and 33% as independents.
- Among Japanese voters, 51% identified as Democrats, while about 1 in 4 identified as Republicans.
- Although Filipino voters had the highest share of independents at 39%, independent identification was significant across all ethnic groups.
California’s overall Democratic lean coexists with a sizable population that does not identify with either major party.
Age adds another layer to this picture. The survey found that Democratic identification was higher among younger generations, while Republican identification was higher among older generations. Younger Asian Californian voters were also less likely than older voters to identify as independents.
Asian Texans lean Republican with differences across subgroups
Texas is home to 2 million Asian Americans and has the nation’s third-largest Asian American eligible voter population, at around 1 million. Asian Indians are the largest ethnic group in Texas, representing over 27% of the state’s Asian population, followed by Vietnamese and Chinese at nearly 16% and 14%, respectively.
Although Texas does not collect political party affiliation during voter registration, recent surveys offer a picture of where Asian Texans stand. According to the 2026 Texas AAPI Voter Poll, 40% of Asian voters in Texas identify as Republicans, compared with 31% as Democrats and 29% consider themselves independent. Asian voters in the Lone Star State are twice as likely to identify as independent than the state’s average voter.
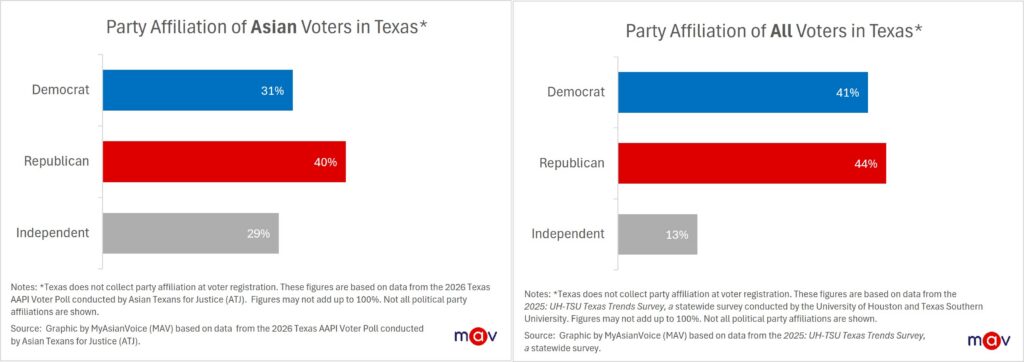
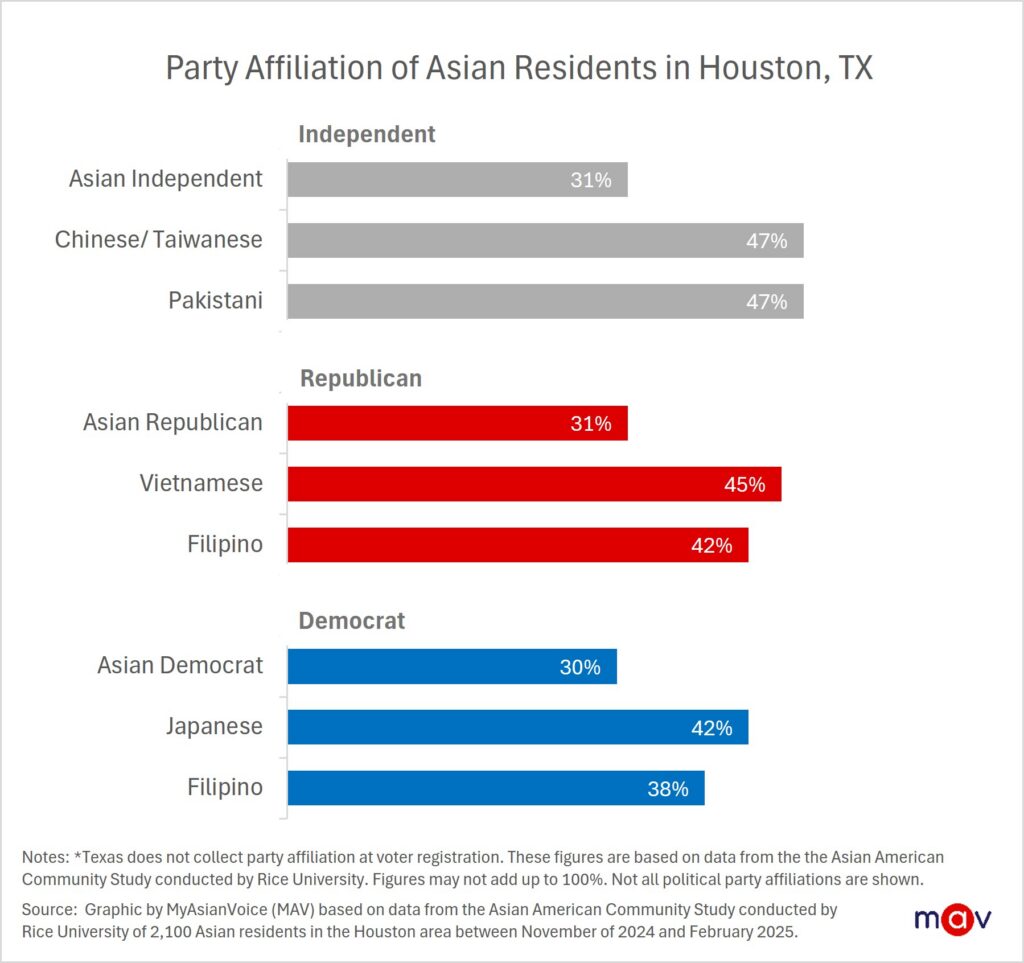
While California’s Asian American electorate leans Democratic, Texas presents a more divided picture. A closer look at the Houston area reveals this complexity. Rice University’s Asian American Community Study found that Asian residents in Houston, TX were ideologically moderate and nearly evenly divided in their party identification: 31% Republican, 30% Democratic, and 31% independent.
Like California, these overall figures mask substantial differences across ethnic groups:
- Nearly half of Chinese/Taiwanese residents (47%) and Pakistani residents (47%) identified as independents.
- Japanese residents were more likely to identify as Democrats (42%).
- Vietnamese residents were more likely to identify as Republicans (45%).
- Filipino residents were divided, with 42% identifying as Republicans and 38% as Democrats.
Asian New Yorkers lean Democratic alongside a substantial unaffiliated electorate
New York offers another nuanced picture of Democratic strength and a substantial unaffiliated electorate. The state has the nation’s second-largest Asian American eligible voter population, at 1.1 million to 1.2 million. Its statewide Asian population exceeds 2 million and is concentrated largely in New York City and surrounding areas. Although diverse, New York’s Asian population includes a particularly large Chinese community, which accounts for about half of the state’s Asian population.
Understanding this electorate requires drawing on multiple sources. New York records voters’ party registration but does not publish a breakdown by race and ethnicity. A case study by the Asian American Federation examined Asian American voters in New York’s 3rd Congressional District, where they make up 17% of all district voters. This district stretches from northeastern Queens into the suburbs of Nassau County. Considered alongside national Asian American voter surveys, the study offers insight into the state’s Asian American electorate. It found that Democratic identification, at 47%, was much more common than Republican identification at 13%. However, a substantial share, 38%, reported no strong party affiliation or is unaffiliated.
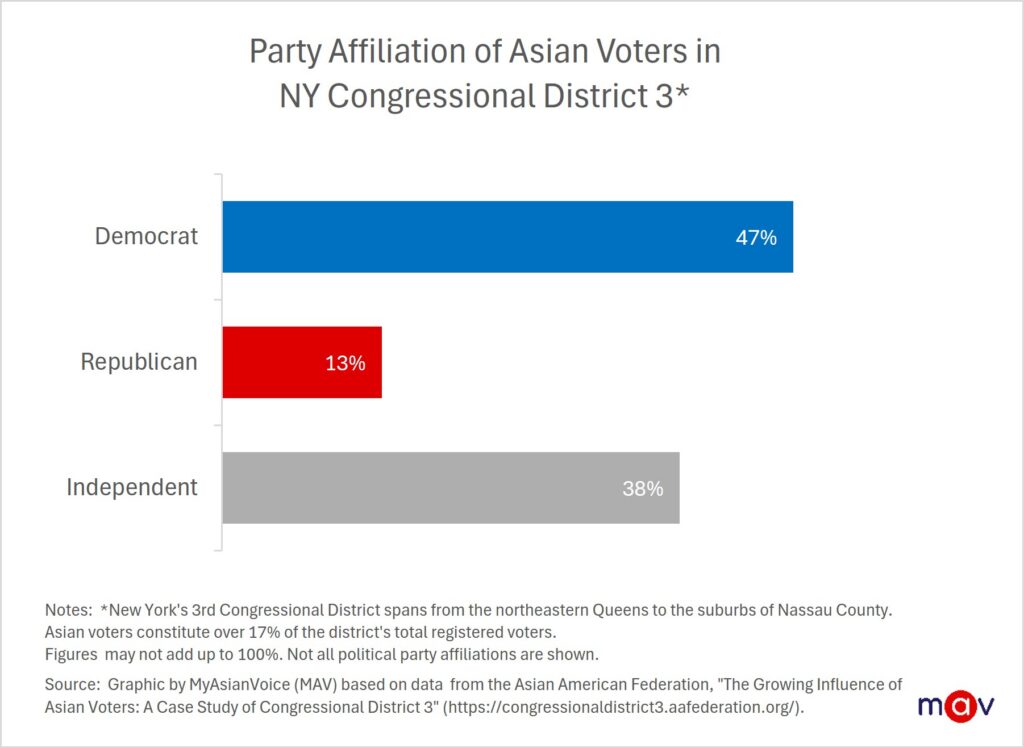
That limited party attachment helps explain why shifts in Asian American support can influence election outcomes. In New York, the Asian American electorate shifted heavily left toward Joe Biden in the 2020 presidential election, then right toward Donald Trump in the 2024, and then overwhelmingly left again toward Zohran Mamdani in the 2025 New York City mayoral race.
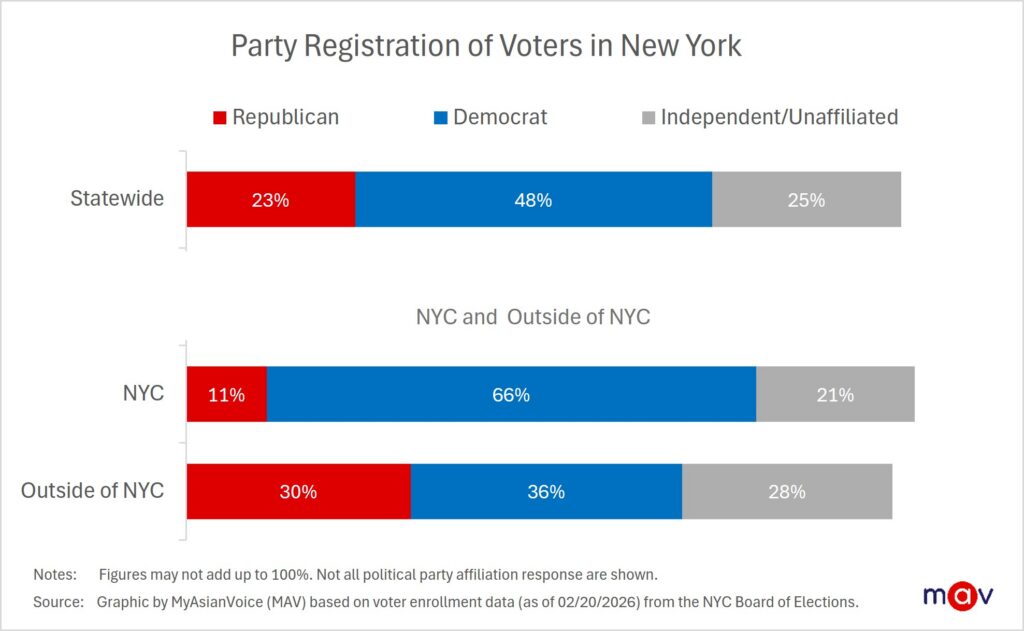
Party registration differs considerably between New York City and the rest of New York, although both areas have substantial unaffiliated electorates. The latest NYC Board of Elections data show that roughly half of all registered voters statewide are Democrats, nearly a quarter are Republicans, and another quarter are unaffiliated.
Breaking those figures down geographically reveals a sharper contrast. Within New York City, 66% of voters are registered Democrats, while 21% or about 1 in 5 are unaffiliated. Outside New York City, 36% are registered Democrats and 30% are Republicans, while 28% or more than 1 in 4 are unaffiliated. These figures describe all registered voters, rather than Asian American voters specifically, but they provide context for the different political environments in which Asian New Yorkers live and vote.
A diverse electorate with growing influence
Taken together, California, Texas, and New York show why national averages offer only a starting point for understanding Asian American voters. Although the electorate leans Democratic, party affiliation varies across states, and a substantial share of voters report no strong party attachment.
Asian Americans are not monolithic. Their political affiliations not only vary by ethnic group, but also by age, generation, nativity, education, and gender:
- Younger and U.S.-born Asian Americans are more likely to identify as Democrats than older and foreign-born voters.
- Asian American voters with postgraduate education are more Democratic, while those with a high school education or less are more likely to lean Republican.
- Asian American women are more likely than Asian American men to identify as Democrats.
These differences reflect varied socioeconomic backgrounds, immigration histories, and religious affiliations.
Yet despite their diversity and growing electoral influence, Asian American voters continue to receive limited outreach from both major parties. Despite outreach gaps, the Asian American electorate continues to grow and shape election outcomes.
***
This article contains original analysis and content developed by MyAsianVoice based on primary data published by third parties. While the underlying data may be publicly available, all insights, visualizations, and derived content, unless otherwise noted, are the intellectual property of MyAsianVoice and are protected under international copyright and intellectual property laws. If you use, reference, or cite any part of our analyzed data or content, you must provide full proper attribution. Required citation include: MyAsianVoice’s full name, title of the article, and direct link to the article.
Helpful Resources
The U.S. Electorate’s Changing Racial and Ethnic Makeup (Pew Research Center)
Asian American Voter Survey (APIAVote)
2024 California Asian American Voter Insights (AAPIData)
AAPI Texans Coming Into Power, Fall 2026 (Asian Texans for Justice)
Voter Enrollment Totals (NYC Board of Elections)
Voter Registration Data by State (Independent Voter Project)
Get a monthly dose of our latest insights!




About
myasianvoice

At MyAsianVoice, we make disaggregated U.S. Asian data visible and accessible.
Subscribe to receive our latest insights >>